Thursday, June 9, 2011

06.09.2011 --- Bounce came.... and went??

I'm going to switch up the format a little here. I'm going to first disclose my current position and what my targets and stops are. Then I'm going to give what would be my best guess of the best performer for the following day if I were to take on a new position.

* This is not investment advice, it is only meant to be a windown into my thought process.

I am current short TNA. I'm short TNA from 88$ /IWM from 84$. My targets are following IWM, I do not chart the leveraged ETF's, I chart the underlying.

My current target is for IWM to hit 76$. My stop has been brought down to $81.55 on IWM. 81.55 stop would now give me a minimum 14% gain on the trade.

Looking forward, IWM now LOOKS like it has the best position to hold it's ground here. IYR was very weak today and lost the 50 and appeared to lose it's long term trend. If I were to take a position for tomorrow, it would be short IYR.

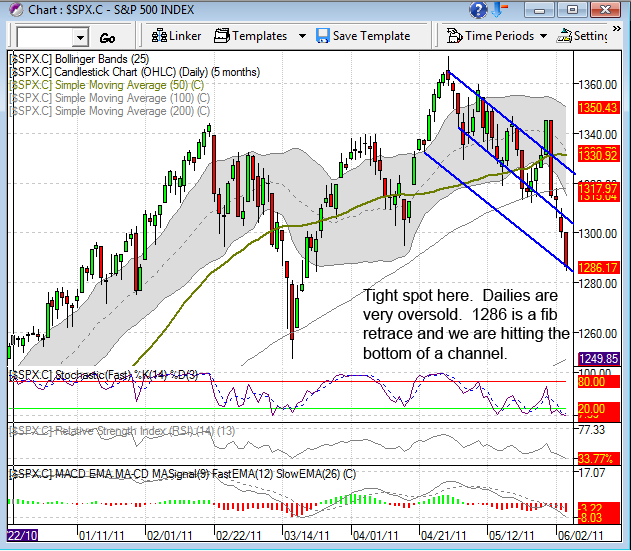
On the S&P hourly charts, we burned off a lot of oversold. On the daily charts though, they just appear to be turning up. I believe this is a trick though. I think the daily will become more oversold after just a tad more for this bounce tomorrow.

I am still looking for the S&P to touch the 1265-1250 range before this correction or particuarly bear move is over and ready for a more severe bounce.

Here are the charts;

S&P hourly, showing we have burned off some oversold and are still underneath the bottom of the old channel. It has both that and the bottom of the bollingers there as resistance;


If you are short the market, that blue lie is probably key, we get significantly above that and we probably have a much stronger rally on our hands.

For the Daily, the stochs, MACD and RSI are just all turning up. However, as I said, I think this is a trick;


Moving on to IWM, this chart looks like it has the best chance to rally. But I already have a good profit on this trade, so will stick with it in case we break down here;


And finally.. IYR. IYR looked strong for awhile, but seems to have lost some reistance here. IYR might have some catch up to do;


Conclusion, we may bounce a bit more, but I think we have some more selling off to do and I think IYR may best the biggest mover to the downside.

GL

CJ

Wednesday, June 8, 2011

06.08.2011 Update -- Same Ish different day

No charts tonight. We are in the exact same place we were yesterday. The DOW is still holding a trendline barely and every is just even more oversold than yesterday.

I think the DOW is holding the fort together here from just taking a swan dive down about 20-30 points on the S&P.

We may bounce, we may not, but as i've been saying, we will at least challenge the 200dma on this sell off. Still looking for the 1265-1250 range on the cash.

Some other points of note;

The XLF. If the XLF was a woman, it would look like this;


That's how ugly the XLF looks. Unless the market pulls some ginormous rally out of its ass here over the next month, I don't think there's any way to avoid the XLF getting a death cross as the 50 crosses under the 200. I don't see how anything could look good for the overall market going forward with the financials sporting a death cross.

For Point 2;

The Transports look like they are crashing. They are down from 5480 to 5080 in 5 days. That's a 400 point move, that's a 7% move in the trannies in 5 days and one of those days was a green close, so really it's lost 7% in 4 days of trading.

For Point 3;

Want to know how truly bloody it's been in the financials?

WFC, BAC, C, MS and GS....

every one of those stocks are down 25-35%!!! for the year. Since Jan. 1.

What was that cocky guys name that was on CNBC pumping the financials a few months ago? The guy that was loaded financials and stocks in general as long as Ben was pumping money. Yeah.. he's probably not having such a good year right about now.

Last Point;

So.. take a wild guess.. Which sector (besides consumer staples and the obvious defensive areas) looks in the best technical shape right now?

.... dum dum dum...dum dum... dum dum dum... dum dum... dum dum.. DUM.... dum dum dum dum dum.. dum dum dum... dum dum.. dum dum dum... DUM... dum dum dum.. dum... dum...... dum...

Yup.. phucking IYR. That thing astounds me. I mean I know REIT's do get some benefit from low rates... but half the index is also the freaking home builders... in a double dipping residential market!.. At some point too, a tanking economy is going to affect rent per sq. ft. If you signed a typical 5 year lease in 06' and made it through all this mess. You're in a good spot... cause it's 5 years later and you should be able to re-negotiate your lease for a lot less money. That thing will crack, it's just a matter of time.

So... for tonight..same deal as yesterday.. oversold can become more and more oversold and we can bounce at any time. But I do expect the 1250-1265 range to be hit before we can think about any possibility of this being over.

GL

CJ

Tuesday, June 7, 2011

06.07.2011 Update -- Awww.. the market doesn't like Ben anymore.. sad.

Right off the bat.. we are oversold, very oversold. But that has not stopped us so far. We did bounce today as expected, but that bounce all bled off and completely retraced to negative as Ben spoke.

We appear to have taken out support that would prevent us from going straight to our target zone which is 1250-1265 on the cash. From experience, if the zone on a selloff is 1250-1265.. we will probably hit 1245 or lower intra-day before this selloff has a CHANCE of being done.

I'll jump right to the charts tonight.

Here's the S&P hourly, I couldn't really find a way to create support with a trendline that showed we had some support for an oversold bounce. We just appear to be heading straight to the zone;


S&P daily, we have 2 trendlines converging on support at 1265 and we also have the 200dma at 1250. Those 2 areas of resistance create our target zone for the most likely place for a major bounce or potentially ending the selloff;


The Russel 2000 is still in it's megaphone pattern and looks to be targeting the bottom of that megaphone. There's nothing really to stop it from going straight there;


And the DOW, which is surprisingly the most interesting at the moment. It is BARELY holding some support here. If it loses that support it could lose about 500 points in a hurry as it is a lot further from the 200dma support than the S&P is;


So in conclusino of all that, it looks as though we are just going to head straight down into support here. The DOW it appears will be taking the brunt of that pain while the slide in the S&P and Russel will not seem as bad.

We absolutely could bounce at any time, because of the nature of being constantly very oversold. That's how these selloffs go though, you have to be on your toes. The best thing to do is just watch the S&P during the day and look for a higher low and higher high, if you see one, get out and wait to see what happens. Getting caught in the ripping bounces if your short is not fun, but leaving too soon or getting caught up in how oversold we are can lead you to the sidelines and miss out on the big moves to the downside.

Bear markets are difficult to trade, that's why they are known for hurting both bulls and bears.

GL

CJ

Monday, June 6, 2011

06.06.2011 Update -- Crash or Dash

The market is at one of those small moments where all short term support could be lost and we could just jump right off a cliff, with strong support being down at 1249 or so on the cash at the 200dma or we will bounce within the short term downtrend here for a day or 2.

I don't believe this sell off will be over until we've at least tested the 200dma, but I also thinks it's probably less likely that we go straight down to it. Tomorrow will answer that question, because if we go any lower there's nothing to stop us from going straight there without a bounce.

Yesterday I said we could bounce short term or the market may just head straight to 1286 and become more oversold. We choose that path. We now sit at 1286 which is the 23.6% fib retrace of the entire rally from June of 2010.

Almost every index/sector is sitting right at or slightly under the full extent of channel support on an hourly chart and we are extremely oversold on the hourlies and very oversold on the dailies.

For a visual picture, lets get to the charts.

Here's the S&P on the daily. It's pretty oversold and we are at a potential channel support line here on top of 1286 being the 23.6% fib;


Here's the S&P hourly. Extremely oversold and right on channel support shorter term as well;


We have the same general thing on the DOW;


And the Russel 2000;


So what does that all mean?

It means we are either gonna have a real dump in the markets tomorrow or we are going to bounce for a couple days, probably to touch the underneath of the 100dma.

I lean towards bounce because the selling has been consistent but not very implusive. Orderly selling usually does not lead to massive sudden declines..... BUT oversold levels do.

So put yer helments on.

GL

CJ

Sunday, June 5, 2011

06.05.2011 Weekend update -- is there another rally left?

I'm going to focus on the S&P alone for this update.

Let me say, it's a tough call here. We are very oversold short term but medium term (over the next month or so) we still have some room to sell off for awhile. To threaten the longer term trend that the market is still in rally mode and this is a correction, we'll need to get down and under the 200dma at 1249ish.

Before moving on the charts, let me also say this might be one of those sell offs that just ends up looking more and more and more and more oversold. You really think it's ready to bounce, but the bounces come in small spurts and it just keeps sliding. The reason I say that is because I've been caught in that trap before. You short the market at a top and everything looks so oversold you figure it has to bounce, so you figure why not take some profits and then wait for the bounce to get short again. Well, in my experience, that results in the market running away from you to the downside and you're stuck on the sidelines.

So while I think a short term bounce is very likely here, I just want to point out that my experience is telling me this is one of those situations where oversold becomes more oversold which becomes more oversold. For that reason, I am not exiting my short position at this time.

Lets start with a chart with some Fib retracements, 1286 is the 23.6% retrace of the rally from July of last year until now. So i expect there to be some fight there. 1286 may end up to be where our oversold bounce starts;


The next chart is a daily 4 month chart. Whether we bounce here or bounce from somewhere lower like 1286, I do not think this correction (if that's what it is) is over. I think we'll touch the 100dma from underneath and then embark on potentially the last wave down;


On the shorter term basis, this is a 60 min 5 week chart. You can see here why I think we may bounce here besides being oversold. We closed right at the bottom of the short term channel on Friday. So it held support within the channel. If we lose that channel tomorrow, then obviously we have more work to do immediately to the downside;


Where this "correction" ends is critical. There are many possible longer term elliot wave counts. Taking out the 200dma would point towards calling the end of the rally from March 2009. Anything above the 200dma has the potential to again rally to yet new 52 week highs.

The financials are really waving their arms here yelling that there are major issues dead ahead. The XLF is not that far away from a potential death cross. It's much closer than any other index or sector. The market cannot rally to new highs with the financials tanking.

If the market is/has been rolling over, it will take awhile and it will be one step at a time. We are under the 50 and 100. Next is the 200. We have to get under the 200 to have the potential of a death cross (the 50 crossing under the 200). Even if we tank hard here, we are months away from a death cross. So these things take time to confirm.

Hope you all had a good weekend, GL tomorrow.

CJ

Thursday, June 2, 2011

06.02.2011 --- Mixed Signals

Obviously we are somewhat oversold here. The DOW is the most oversold, while the S&P and Russel 2000 do have some room. But oversold can always become more oversold. So that alone is never a reason to abandon a position or try to catch a falling knife in a bear move.

Not a whole lot changed from yesterday.

The DOW held the 100 today. Which is symbolically and psychologically important, but not super important because the DOW is only 30 stocks. The DOW though looks the most oversold and after holding the 100, looks the most ready for a bounce here;


The S&P on the 7 month daily chart looks to have broken and closed under the 100dma. Now, I don't know about you, but I think 500 stocks are more important than 30 stocks. So we have a mixed signal here;


On a shorter term basis, we appear to have closed just under some resistance in the middle of the channel. We could either take that out and head to the top tomorrow, or we could finish and head to the bottom. So short term is a 50/50 call here, not much better than roulette;


Not much changed for the Russel 2000 or XLF. Russel is still holding support and is still above the 100dma. The XLF is still floating around in no mans land below all moving averages.

What the bears really want here is for the Russel, S&P and DOW to all take out the 100, and then give the 50 and 100 some time to roll over and start heading south. We have a lot of ground to cover to converge the 50 and 100 with the 200 and we need the 50 to cross the 200 to get the dreaded death cross.

But one step at a time...

GL

CJ

Wednesday, June 1, 2011

06.01.2011 Update.. the bears are back...

Well.. yesterday looked like the bulls were ready to stampede and all signals were go. As mentioned yesterday, the bears had 3-4 days to get a violent reversal and erase those technical break outs.

The bears got their violent reversal.

So here we are back in almost the same place we were last Friday.

The S&P had a particularly nasty close, back below both moving averages and in a gaping hole of missing support. The 1 saving grace for the S&P is that it only closed SLIGHTLY below the 100dma and under trend support.

Looking deeper inside.. The XLF also had a very nasty close. I think we have another banking crash on the horizon. I have speculated why in previous posts, which revolves around the banks using much of their pervious loan loss reserves to pump earnings and at the same time the housing market is double dipping. That combination will put us directly back into the same position we were in during 2007-2008. I wonder if the banks have done so on purpose always believing that they will not be allowed to fail, therefore why reserve a bunch of our own money to get eaten by losses. Who would have thought the moral hazard of the bail outs might actually be moral hazards.

The Russel 2000 and IYR are in better shape but are not far from being in the same place as the S&P. Honestly, with the economic news we've had lately, I'm surprised the Russel isn't leading the way down here. IYR will continue to benefit from falling treasury rates. Occupancy rates will be key. I also suspect REIT's are quickly losing pricing power per square foot on typical 5 year lease renewals. 5 years means people who signed 5 year leases in 2006 during the boom and the good times are finally getting the chance soon to bounce out of those or re-negotiate them. REIT's will likely take a hit from that dynamic.

so here we are back to about where we were Friday with some ultra ugly candles.

Charts to warm a bears soul; (all are 7 month daily charts)

S&P


Russel 2000 (IWM)


The Financials (XLF)


Dow Jones Real Estate (IYR)


If we get a follow through day on the downside here between tomorrow and Monday the bears will really have something to hang their hats on.

The 200dma for the S&P is down around 1240. It won't be completely doomed for a lasting bear market without getting and staying under that. But a minimum pullback to that level is definitely on the table here, provided we stay under the 50dma.

GL

CJ