Tuesday, July 31, 2012

07.31.2012 - Dual pattern..

So, I tried to make sense of the short term chart.  The SPX hourly over a 10 week period.  I couldn't make heads or tails of it, which is pretty rare.  Usually I can find a dominant pattern, but its just chaos.  There's no less than 10 different channels, wedges, megaphones, etc. that you could make on it.  So for now, I'm just avoiding it.  Short term, I have no idea whats going to happen. 

I did find something of interest though in the daily and weekly charts.

The Daily chart ( 7 months ) and Weekly chart ( 7 years ) are sporting the exact same pattern.  It's actually quite striking how similar they are.

The only problem is that both patterns are at the same exact point in their development.  So there's nothing to foreshadow. 

What I can say though, is whatever happens next will be confirmed in all 3 longer term timeframes.  The Monthly, Weekly and Daily.  Because they are all sporting the same pattern.

Here they are;


Sunday, July 29, 2012

Weekend update

The following chart will pretty much show everything that needs to be shown right now for the short term.  If the S&P gets past 1402, we'll be heading for new highs and potentially all time highs through the election.

There are still lots of reasons on the longer term charts to think this is a fake out though.  Including all the Daily, weekly and monthly charts for the S&P rising with a falling RSI for quite awhile now.

But for now, Friday was a strong day, lots of growth stocks (like AMZN??) powering ahead. 

The market obviously believes we are going to get a strong round of Fed intervention soon.

Heres the short term chart (SPX hourly)

Thursday, July 26, 2012

07.26.2012 -- Trading N stuff

Things are settling down with my newest family additions and I'm going to get this going again, however, it will be in a shorter format than my previous posts with less commentary except maybe a commentary only post over the weekend.

Since this is the first post in awhile, I will do a quick update here.

Lots of growth leaders are breaking down while this market still feels like it wants to break higher. Growth stocks, especially ones that have been hot, are getting hammered on missed earnings. FB, NFLX, CMG, ZNGA to name a few have gotten seriously pounded. 20%+ smashings.

The market is stuck between QE3 expectations and worsening economic data. 
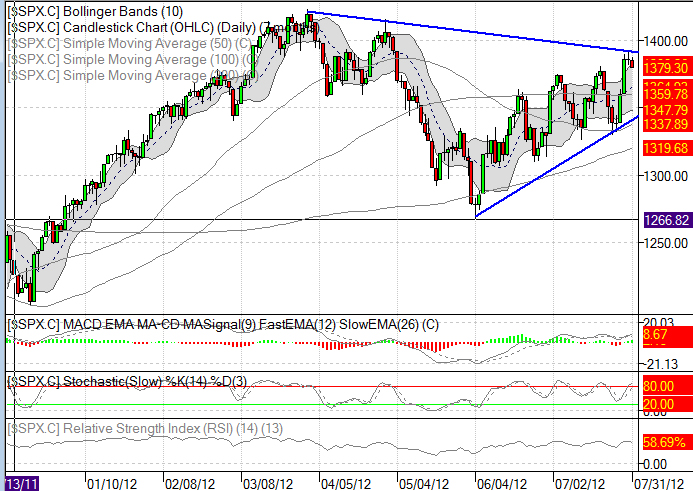
The close today was very interesting. Most would have guessed that we rallied handily back into previous wedges and back over support lines. This actually doesn't appear to be the case. It looks like a back test. The following charts are SPX cash in 3 timelines.. Weekly, Daily and Hourly. The daily and hourly show how we appear to have completed a backtest at the moment unless we manage to have another decent day tomorrow.

Charts;

The market still has issues here. GL CJ