Thursday, June 30, 2011

06.30.2011 -- 1320!? SHOCKING.. SHOCKING I SAY...

Appologize for the last update...

We, ever so surprisingly, closed at the maximum extent of resistance right at the end of the quarter.

We ran no less than 51 points on the S&P in 4 trading days. EVEN DURING turmoil and protests in Greece BEFORE the vote even happened.

but wait... Window dressing is illegal. it does not happen.

My ass it doesn't happen. Snorting blow is illegal too, but it doesn't mean nobody is doing it. It just means they aren't getting caught.

Anywho, maybe folks who didn't will pay attention next time that we are near end of a quarter. If there's saving to be done, they will save it.

Moving on..

The FED did it's last POMO of QE2 today. Anyone seen what happened with bonds the last couple days? Keep an eye on that. When (not if) they pass the debt ceiling hike, issuance is going to ramp to catch up and this is at the same time we have some auctions going badly with the FED back pedaling. If you had any intentions of buying a home or refinancing, you might want to do that real soon.

And in other news, Mr. Turbo Tax Timmy might step down after the debt ceiling hike finally happens. Most of you will cheer... YEAH!.. GO FUCK YOURSELF GEITHNER!!.. I don't like turbo Timmy either, in fact I hate him and Bernanke and all the other banker slime. I have unfortunate news for you though.. flowers don't grow on slime. You think some champion of fiscal sanity is going to suddenly come out of nowhere and be Timmy's replacment to fix the world? Sadly... no. Slime will be replaced with.... you got it... more fucking slime. Remember that Geithner replaced our good friend Hank Paulson, who decided it was a good idea to bail out every bank in existence to the tune of 3 trillion dollars I think we've spent now. Sorry, but prepare yourself for more slime.

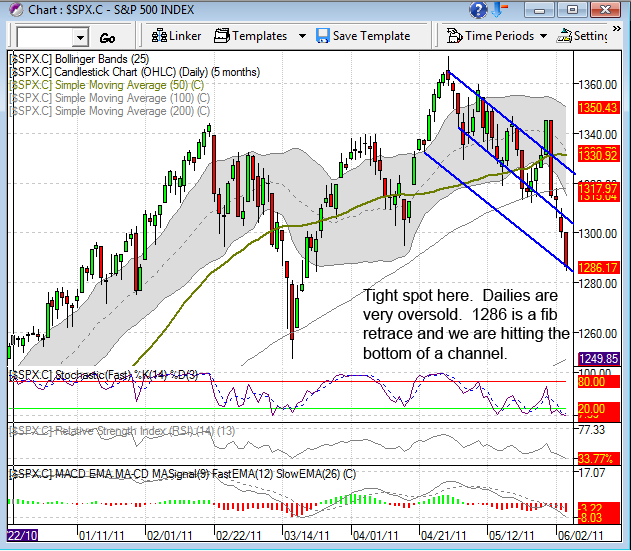
Only 1 chart for tonight;


As you can see, we closed above both the 50 and 100dma's, which is significant, but we also closed right at the last line of resistance, which is our last potential downtrend line for the correction.

Mostly bad news for bears here. All I can say is that we are now VERY overbought on the slow stochs, but we have room in the MACD and RSI all on the daily. I'm neutral overall on those signals. All the bears really have here is that we are still under that trendline and the hourly stochs, MACD and RSI are extremely overbought. So we most likely have a pullback coming after today.

The question is what that pullback looks like. If it's a mild pullback that just kind of floats lightly down for a few days to burn off overbought, look out, we are going flying north and probably to new highs. The bears will desperately need this next round of selling to be very impulsive and overpowering.

Otherwise, I expect to see over 1400 sometime this summer before this really tops sometime late this year, early next year. With the Greece can kicked, there's not a lot of catalysts to the downside. Bears either need treasury rates to go flying north, oil prices to go flying north again, or another country in Europe to join the bailout begging club.

GL

CJ

Tuesday, June 28, 2011

06.28.2011 -- End of Quarter

Not much really new to add here.

End of quarter is Thursday. As speculated, they are gunning it and aiming for 1316-1320 by Thursday is my guess.

Here's the chart;


So there you have it..

After Thursday and after we reach heavy resistance, we'll have to see what happens. New highs are potentially on the table if we were to close higher than 1320.

Of course a bad Greece vote could blow everything to hell.

GL

CJ

Monday, June 27, 2011

06.27.2011 -- Pause til end of quarter

It's looking like we are either taking a pause in this selloff until end of the quarter (this Thursday), or we are going to try to breakout and close the quarter out on as high a note as possible.

We are in a heavy resistance and support area, it will take some doing for the market to break in either direction.

Support/Resistance..

Support -- 1265 (200dma) and 1250 (round number and trendline)

Resistance -- 1285 (trendline), 1290 (trendline), 1295 (middle of the bollingers), and 1316-1320 (50dma, 100dma, top of the bollingers)

If they really want to gun the end of Quarter, they'd try and target 1315 by Thursdays close.

Here's the S&P chart;


As you can see, we are stuck in the middle of a little CF right there. Time is running out though, if they don't try to make a move north by Thursday, things will get more interesting and the 200dma and the downsloping trendline will force the issue by the end of next week.

As mentioned, end of quarter, they are gunning all the momo stocks, Amazon, Chipotle, Lululemon, Green Mountain Coffee,.. they've all been bought hard since the 2nd week of June. Prop up those large growth holdings to make the quarter look good and then I expect we may see some distribution out of those types of names.

I think even with all this hard buying of the momo stocks, we are having a hard time even challenging the middle of the bollinger bands, and with only 4 days left until interest in propping up big growth winners goes away, I'm thinking the most likely path going forward is down for another challenge of the 200dma and a challenge of the recent 1258 low.

GL

CJ

Sunday, June 26, 2011

06.26.2011 -- Pick a direction will ya...

First important levels of support and resistance...

Support is at 1263 for the 200dma. Below that we have the bottom of a channel i'm tracking in the mid 1250's and then round number support at 1250.

Bears want to see a CLOSE under the 200dma as well as a new low, which means a close under 1258 and a close under round number support at 1250 would be pretty nasty.

Resistance, we have the bottom of the bollingers, which we closed back under again at 1273 and then trendline resistance and middle of the bollingers at 1285ish and 1293.

The bears have to have a close under the 200 and they have to have a new low for bad things to happen here. Which means a close under 1258.

Thursday this week is end of the month and end of the quarter so keep that it mind, it is a window dressing time of the year. A break down of the market this week would be particularly bad, because it would really signal panic creeping into the market.

As it has been lately, the Russel and Dow Jones Real Estate are out performing and the S&P is in the most dangerous spot technically. The Russel will need to break down again for the S&P to lose the 200.

Here's the chart for the weekend, just the S&P for now. What the S&P does here will seal the deal on what comes next;


Important week..

GL

CJ

Wednesday, June 22, 2011

06.22.2011 -- Still in the bollingers for now..

For those who don't like reading my babble about events surrounding the market, here are key levels, aka prime reversal spots;

Upside 1301 (Mid-Bollinger), 1316-1320 (50 and 100 dma's), and 1330 (top of bollingers)

Downside 1285 (2 important trendlines), 1275 (bottom of bollingers), 1261 (200dma)

Apparently the market thought Ben was going to announce an extension of QE2 or something today as it didn't like that fact that he lowered his economic forecast and basically said the economy entering a period of stagflation. Stagflation is a economic state of stagnated or shrinking growth and rising unemployment and inflation.

All Ben is gonna give right away is some more QE lite after the end of the month. I guess that combined with a forecast of stagflation is not what the market wanted to hear. Go figure.

Here's what the market heard from that entire thing...

"Conditions are worsening and I'm doing less about it"

My response would be... well..what did you expect? Did they really believe that Ben could mount another campaign of 600 billion dollar monetizations while Congress is in a budget war?

Some interesting things today, but only 1 chart.

First off, most sectors and indexes (or is it indicies, i never know) closed still well inside their bollinger bands. The S&P closed directly on a couple converging trend lines, but that said another large sell off that puts the S&P, Russel and DOW back under their bollingers could be a real problem for the market.

The futures are looking pretty ominous right now. I would tread very lightly here though as we are heading into end of month and end of quarter.

If we do sell off tomorrow though and the S&P closes back under the bollingers, we are likely going to test the 200dma again and the market will have some real problems on its hands. Hard to believe that is "allowed" to close out a quarter with a technical breakdown. It would be a rare occurance to have the market break down right at quarter end when there's usually window dressing going on and a very dangerous occurance as it would mean everyone is saying screw the quarter, I want OUT NOW.

The only other thing of interest today is that while still well within the bollingers and not in technical danger quite yet, IYR and the Transports put in some nasty looking reversal candles today. Candles are just one of those little things that add a bit to your probabilities but they are some ugly candles.

Here's the chart showing our key levels and why the S&P is in technical danger if we get another decent sell off tomorrow;


If the futures keep this up, we'll obviously open below that trendline support, then we have the bottom of the bollingers there. Below that is the 200dma and then that's it, below that is air. Probably flash crash land.

If the bears were going to avoid a trip back to highs, this had to happen and tomorrow needs to be another ugly day. If we get another ripper north and put in a higher low over the next couple days, we'll be off to the races.

GL

CJ

Tuesday, June 21, 2011

06.21.2011 -- Back in the Bollingers

As suspected yesterday, we looked ready to bounce and only needed a couple more points to confirm and we took off today, breaking through the bottom of the bollinger bands and heading up towards the middle.

On the daily chart, the MACD, Stochs, and RSI are all now on a buy, and there's lots of room left for movement north.

June is EOQ. (end of quarter), so we are now dealing with daily signals all on a buy, end of the month and end of the quarter. Window dressing galore. They'll want to rally the heck out of this pile and make this Q look like only a slight down tick on everyones 401k statements.

New highs are possible, but even if we do, it's all still part of an ongoing topping process.

Key levels for tomorrow on the upside that might see some resistance;

1302 is the middle of the bollingers, considering we are short term overbought, i expect that to cause at least a pause.

Then we have a cluster in the 1316-1320 that contains both the 100 and 50 day moving averages. That area will provide strong resistance.

After that we have the top of the bollingers at 1328ish. A move past 1330 will likely send us to new 52 week highs.

so in short, 1302 (weak), 1316-1320 (Strong), 1328-1330 (medium)

Here's the chart;


GL

CJ

Monday, June 20, 2011

06.20.2011 -- Bangin the Bottom of the Bollingers

Sorry for the weekend pause, was getting in some needed Fathers Day rest.

There's only 1 chart for today, because that's all we really need, but first a few words.

Everything still looks like crap, the financials (XLF) are about to get a death cross, the NAS is weak while the buying heads into the DOW. That is a sign of distribution of big players for the high growth tech names and into large liquid behemoths. Apple appears to be rolling over, leaders like BIDU and PCLN look like crap. Amazon and Google have been looking like crap.

IYR seems to be getting a bid here, but that's not unexpected considering the REIT's are paying dividends at much higher rates than treasuries. The ignoring of the book value of their assets though is stunning.

End of story, everything looks like crap except defensive names and dividend payers.

That said, we look like we are about to bounce here. It's normal, it's all part of forming a top which as I've said many times, takes TIME. Sometimes lots of time. We need time for the moving averages to compress and time for the 50 to cross under the 200 and give us a bear market signal.

All that's stopping us for a big bounce is the bottom of the bollinger bands. We closed right on the bottom today. Just a few more points and we'll shoot up into it and burn off some oversold on the daily. If we break through the bottom of the bollingers, we'll have another 20-40 points coming on the north side.

Here's a visual; (the gray area is the bollinger band)


So there you have it.

GL

CJ

Thursday, June 16, 2011

06.16.2011 -- Jack in the box..

This market is like a jack in the box right now. The handle is turning and the music is playing, and any minute you know Jack is gonna burst out of the hole and scare the ish out of you, and you know it's close, it just hasn't happened yet.

The VIX is really perking up here. The selling is becoming more impulsive and we are getting things like back to back reversals. The pent up emotions of the market are starting to return. The lost element of fear is creeping back in. The "Fed has our back" security blanket is fading. Buy the dip is no longer always working.

As I mentioned yesterday, the XLF and Russel are looking like the strongest areas and the areas most likely to lead a bounce. They looked strong today. The XLF clocked a half a percent gain and the Russel, which usually follows the NASDAQ more than the S&P, had a quarter precent gain while the NAS slid almost 8 points. So they both outperformed today.

For the market to continue to go down with any conviction, the XLF and Russel MUST put in a new low.

I have some targets on the S&P for you tomorrow. 1275 is critical for a breakout north, with some more resistance up around 1285. For the downside, the market need only take out 1256 (the 200dma). Considering it's triple or quadruple witching for options tomorrow, I'm not sure either of those levels will be heavily tested tomorrow, but I have seen stranger things.

Here are the S&P charts; (I didn't do Russel or XLF charts as nothing really changed with them from yesterday)

On the daily, the Stochs and RSI are almost tripping a buy signal, the MACD is not quite there yet; Key levels are shown..


On the hourly, we are on a buy but have burned off a decent amount of oversold, almost to a neutral signal. This shows the 1285 resistance more clearly;


So long story short... I would short a close that takes out 1256 and buy a close that takes out 1286.

The next move is likely to be violent.

I personally think we have one more big downdraft left in this selloff.

GL

CJ

Wednesday, June 15, 2011

06.15.2011 -- Something violent comes..

I don't know which way it's going to be, but we appear to be setting up for a very violent move one way or the other soon.

I'm a little short on time tonight, so I'll just get right to it.

The S&P looks like it could go down more, but we have the 200dma to contend with at 1256;


It's still in a downtrend and is not severely oversold, the stochs, MACD and RSI all appear to be on a sell, but definitely in oversold territory. The S&P chart leaves me feeling that we touch the 200 for sure at least.

Now.. the bullish sectors I could find.

The Russel has put in a higher low and a higher high. It looks like it could have a trend change here. That said, a quick downdraft and a new low would erase that. So it must be watched carefully tomorrow. If tomorrow is red, key will be whether the Russel falls apart and puts in a new low or hangs tough in another red day;


The other bullish chart is the XLF.. yeah.. the XLF. No really.. the XLF. It's in the same situation as the Russel. If we are red tomorrow, the XLF action will also be key. Does it hang tough or lose it's composure and put in a new low.


That's pretty much the story right here. The next move is going to be violent. If tomorrow is red, I would specifically watch the Russel and XLF, they could be a tell for the next move. If we are green tomorrow, I would expect rippers from the Russel and XLF, if we're green and those 2 are just not pulling their weight, it would be a sign we are about to head south fast.

GL

CJ

Tuesday, June 14, 2011

06.14.2011 -- Risk on.

Well we got 1265 on an intra-day basis which was the very top of my target range. I expected more, but that may be all she wrote for awhile. We still have a small chance to turn back down as the S&P needs to clear 1295 to cement a ride well back into the 1300's.

I am still sidelined at the moment. If the S&P takes out 1295, I will be going long by way of shorting TZA.

I would not take a new position as of this moment.

I do think we have the beginnings of a trend change in place here. We are forming a top. Just remember a top took nearly a year to form before the 2008 sell off and the death cross (the 50dma crossing under the 200dma) confirmed it and that's when the real selling started.

We are months away from a potential death cross in the S&P or DOW. So we have some work to do. We are forming a top, but it will take time.

Here are some reasons I am pretty certain we are forming a top;

1) Selling is now long and orderly while the rallies/bounces are becoming violent and short.

2) The Financials look terrible and are acting how they did before the financial collapse in 08'.

3) Defensive area's like Consumer staples, Tabacco, Drugs and Utilities are leading.

4) Mutual funds are very low in cash, where's the money going to come from to continue to push this market to new highs?

5)The SOX is awful and is a leading indicator.

All that said, the S&P just needs a little more work higher and it will be able to rocket well into the 1300's.

Here are the charts for tonight;

S&P Daily, you can see here that it is just starting to roll off oversold on the daily, so there's definitely a lot of time for rallying. Potentially to new highs if we keep getting days like today;


S&P hourly, we are overbought on the hourly, so we might have a pause/pullback here after today's rally before continuing higher; 1295 is key and after a pause/pullback, the S&P MUST take out 1295 or it may head right back down;


The Russel daily looks like the S&P, just starting to swing up off oversold. The Russel just needs to breach the bottom of the bollingers around 76.60 on IWM to rocket higher;


So there you have it, in short, the market fell just short today of closing at levels that would confirm we are about to rocket higher. Since we are overbought on the hourly, I suspect we will pause and then take a shot at breaching those levels.

If we breach them, it will be risk on and rocket time. If we don't, it would mean we may collapse right back to where we started and lower.

S&P 1295 and IWM 79.60 Key levels.

GL

CJ

Monday, June 13, 2011

06.13.2011 -- Parabolic moves and Doji's

The S&P printed a flat Doji candlestick today. By itself it's a neutral signal, but what does it signal in the middle of a parabolic selloff? I guess we're about to find out. I lean towards a neutral signal in the middle of a heavy selloff probably being a positive sign, but at the same time, the fact that the market could barely muster a gain today after the selloff we've had doesn't leave warm and fuzzies for the dip buyers.

The market tripped my tightened stop today on TNA. I locked in a gain on that trade of a little over 20%. I am sidelining myself here to see what happens in this relatively tight spot from 1270-1253(200 dma). If we open red tomorrow, I may jump right back on board here in anticipation of a quick drop to the 200. Otherwise, I will be watching for a bounce to re-enter.

If you have no position, I would not enter a new position here.

Our targets and patterns have not changed, so I will just present the charts with the notes;

The S&P printed a neutral Doji today. This sell off has a parabolic feel to it as I've marked and we are inside of 20 points to the 200dma;


The Russel looks similar to the S&P, but it has even less room to the 200dma;


The XLF has only a few weeks at most until it gets a death cross. It will need a pretty hefty rally to avoid it;


The 200dma's will obviously provide some type of resistance to this selloff considering how oversold we are, but I am certainly leaning towards taking out the 200dma's after we bounce off it. That would take a move to new highs off the table. If we hold the 200's, we still must consider we may see new market highs this year.

GL

CJ

Sunday, June 12, 2011

Weekend Update 06.12.2011 -- Reversal this week?

We are getting really close to some spots where some real resistance should show up. S&P, IYR, IWM, and Transports are all within earshot of the 200dma here.

The DOW is still about a 250 point drop from the 200, so it might have a bit of catching up to do here.

I'm still short TNA, my stop has been moved down to 70.25. That represents a locked in gain of 20% minimum on this trade.

My IWM target is 77$.

I would probably not start a new position here, I think it would be best to let this selloff exhaust itself and then play the bounce. But if I must short something here, it would be the DOW.

We are obviously very oversold, but that can stay that way always for longer than you would expect. This is itchy trigger finger zone though.

We are awfully close to resistance, but I wonder if we'll have a good bounce first and then head back down to finish this off in the target areas. Have to be nimble here.

Charts... you will plainly see how close we are to some major support in these;

The S&P will soon be dealing with a couple trendlines of support and the 200dma.


IWM is within 1% of 2 forms of support;


IYR finally lost it's support but really plunged and is now within only a couple percent of more support;


The VIX finally perked up a bit on Friday. Even just corrections must cause some elevated level of fear before they can bottom. The VIX just now perking up makes me think there still may be a lot of calendar time left in this selloff, but not much room left in the S&P unless we start cracking 200dmas.

If nothing else, the rest of this year should be interesting. Elliot Wave analysis is predicting anything from new highs this fall... to market going to zero in 2012. In the case of McHugh, he's calling for new highs AND the market going to near zero by 2014.

In my relatively short 14 years of following the markets, i've never experienced a market this bi-polar with a tag that literally anything could happen in the next 12 months. S&P 1600 or S&P 150... there's a case to be made for both.

Put yer helmets on.

GL

CJ

Thursday, June 9, 2011

06.09.2011 --- Bounce came.... and went??

I'm going to switch up the format a little here. I'm going to first disclose my current position and what my targets and stops are. Then I'm going to give what would be my best guess of the best performer for the following day if I were to take on a new position.

* This is not investment advice, it is only meant to be a windown into my thought process.

I am current short TNA. I'm short TNA from 88$ /IWM from 84$. My targets are following IWM, I do not chart the leveraged ETF's, I chart the underlying.

My current target is for IWM to hit 76$. My stop has been brought down to $81.55 on IWM. 81.55 stop would now give me a minimum 14% gain on the trade.

Looking forward, IWM now LOOKS like it has the best position to hold it's ground here. IYR was very weak today and lost the 50 and appeared to lose it's long term trend. If I were to take a position for tomorrow, it would be short IYR.

On the S&P hourly charts, we burned off a lot of oversold. On the daily charts though, they just appear to be turning up. I believe this is a trick though. I think the daily will become more oversold after just a tad more for this bounce tomorrow.

I am still looking for the S&P to touch the 1265-1250 range before this correction or particuarly bear move is over and ready for a more severe bounce.

Here are the charts;

S&P hourly, showing we have burned off some oversold and are still underneath the bottom of the old channel. It has both that and the bottom of the bollingers there as resistance;


If you are short the market, that blue lie is probably key, we get significantly above that and we probably have a much stronger rally on our hands.

For the Daily, the stochs, MACD and RSI are just all turning up. However, as I said, I think this is a trick;


Moving on to IWM, this chart looks like it has the best chance to rally. But I already have a good profit on this trade, so will stick with it in case we break down here;


And finally.. IYR. IYR looked strong for awhile, but seems to have lost some reistance here. IYR might have some catch up to do;


Conclusion, we may bounce a bit more, but I think we have some more selling off to do and I think IYR may best the biggest mover to the downside.

GL

CJ

Wednesday, June 8, 2011

06.08.2011 Update -- Same Ish different day

No charts tonight. We are in the exact same place we were yesterday. The DOW is still holding a trendline barely and every is just even more oversold than yesterday.

I think the DOW is holding the fort together here from just taking a swan dive down about 20-30 points on the S&P.

We may bounce, we may not, but as i've been saying, we will at least challenge the 200dma on this sell off. Still looking for the 1265-1250 range on the cash.

Some other points of note;

The XLF. If the XLF was a woman, it would look like this;


That's how ugly the XLF looks. Unless the market pulls some ginormous rally out of its ass here over the next month, I don't think there's any way to avoid the XLF getting a death cross as the 50 crosses under the 200. I don't see how anything could look good for the overall market going forward with the financials sporting a death cross.

For Point 2;

The Transports look like they are crashing. They are down from 5480 to 5080 in 5 days. That's a 400 point move, that's a 7% move in the trannies in 5 days and one of those days was a green close, so really it's lost 7% in 4 days of trading.

For Point 3;

Want to know how truly bloody it's been in the financials?

WFC, BAC, C, MS and GS....

every one of those stocks are down 25-35%!!! for the year. Since Jan. 1.

What was that cocky guys name that was on CNBC pumping the financials a few months ago? The guy that was loaded financials and stocks in general as long as Ben was pumping money. Yeah.. he's probably not having such a good year right about now.

Last Point;

So.. take a wild guess.. Which sector (besides consumer staples and the obvious defensive areas) looks in the best technical shape right now?

.... dum dum dum...dum dum... dum dum dum... dum dum... dum dum.. DUM.... dum dum dum dum dum.. dum dum dum... dum dum.. dum dum dum... DUM... dum dum dum.. dum... dum...... dum...

Yup.. phucking IYR. That thing astounds me. I mean I know REIT's do get some benefit from low rates... but half the index is also the freaking home builders... in a double dipping residential market!.. At some point too, a tanking economy is going to affect rent per sq. ft. If you signed a typical 5 year lease in 06' and made it through all this mess. You're in a good spot... cause it's 5 years later and you should be able to re-negotiate your lease for a lot less money. That thing will crack, it's just a matter of time.

So... for tonight..same deal as yesterday.. oversold can become more and more oversold and we can bounce at any time. But I do expect the 1250-1265 range to be hit before we can think about any possibility of this being over.

GL

CJ

Tuesday, June 7, 2011

06.07.2011 Update -- Awww.. the market doesn't like Ben anymore.. sad.

Right off the bat.. we are oversold, very oversold. But that has not stopped us so far. We did bounce today as expected, but that bounce all bled off and completely retraced to negative as Ben spoke.

We appear to have taken out support that would prevent us from going straight to our target zone which is 1250-1265 on the cash. From experience, if the zone on a selloff is 1250-1265.. we will probably hit 1245 or lower intra-day before this selloff has a CHANCE of being done.

I'll jump right to the charts tonight.

Here's the S&P hourly, I couldn't really find a way to create support with a trendline that showed we had some support for an oversold bounce. We just appear to be heading straight to the zone;


S&P daily, we have 2 trendlines converging on support at 1265 and we also have the 200dma at 1250. Those 2 areas of resistance create our target zone for the most likely place for a major bounce or potentially ending the selloff;


The Russel 2000 is still in it's megaphone pattern and looks to be targeting the bottom of that megaphone. There's nothing really to stop it from going straight there;


And the DOW, which is surprisingly the most interesting at the moment. It is BARELY holding some support here. If it loses that support it could lose about 500 points in a hurry as it is a lot further from the 200dma support than the S&P is;


So in conclusino of all that, it looks as though we are just going to head straight down into support here. The DOW it appears will be taking the brunt of that pain while the slide in the S&P and Russel will not seem as bad.

We absolutely could bounce at any time, because of the nature of being constantly very oversold. That's how these selloffs go though, you have to be on your toes. The best thing to do is just watch the S&P during the day and look for a higher low and higher high, if you see one, get out and wait to see what happens. Getting caught in the ripping bounces if your short is not fun, but leaving too soon or getting caught up in how oversold we are can lead you to the sidelines and miss out on the big moves to the downside.

Bear markets are difficult to trade, that's why they are known for hurting both bulls and bears.

GL

CJ

Monday, June 6, 2011

06.06.2011 Update -- Crash or Dash

The market is at one of those small moments where all short term support could be lost and we could just jump right off a cliff, with strong support being down at 1249 or so on the cash at the 200dma or we will bounce within the short term downtrend here for a day or 2.

I don't believe this sell off will be over until we've at least tested the 200dma, but I also thinks it's probably less likely that we go straight down to it. Tomorrow will answer that question, because if we go any lower there's nothing to stop us from going straight there without a bounce.

Yesterday I said we could bounce short term or the market may just head straight to 1286 and become more oversold. We choose that path. We now sit at 1286 which is the 23.6% fib retrace of the entire rally from June of 2010.

Almost every index/sector is sitting right at or slightly under the full extent of channel support on an hourly chart and we are extremely oversold on the hourlies and very oversold on the dailies.

For a visual picture, lets get to the charts.

Here's the S&P on the daily. It's pretty oversold and we are at a potential channel support line here on top of 1286 being the 23.6% fib;


Here's the S&P hourly. Extremely oversold and right on channel support shorter term as well;


We have the same general thing on the DOW;


And the Russel 2000;


So what does that all mean?

It means we are either gonna have a real dump in the markets tomorrow or we are going to bounce for a couple days, probably to touch the underneath of the 100dma.

I lean towards bounce because the selling has been consistent but not very implusive. Orderly selling usually does not lead to massive sudden declines..... BUT oversold levels do.

So put yer helments on.

GL

CJ

Sunday, June 5, 2011

06.05.2011 Weekend update -- is there another rally left?

I'm going to focus on the S&P alone for this update.

Let me say, it's a tough call here. We are very oversold short term but medium term (over the next month or so) we still have some room to sell off for awhile. To threaten the longer term trend that the market is still in rally mode and this is a correction, we'll need to get down and under the 200dma at 1249ish.

Before moving on the charts, let me also say this might be one of those sell offs that just ends up looking more and more and more and more oversold. You really think it's ready to bounce, but the bounces come in small spurts and it just keeps sliding. The reason I say that is because I've been caught in that trap before. You short the market at a top and everything looks so oversold you figure it has to bounce, so you figure why not take some profits and then wait for the bounce to get short again. Well, in my experience, that results in the market running away from you to the downside and you're stuck on the sidelines.

So while I think a short term bounce is very likely here, I just want to point out that my experience is telling me this is one of those situations where oversold becomes more oversold which becomes more oversold. For that reason, I am not exiting my short position at this time.

Lets start with a chart with some Fib retracements, 1286 is the 23.6% retrace of the rally from July of last year until now. So i expect there to be some fight there. 1286 may end up to be where our oversold bounce starts;


The next chart is a daily 4 month chart. Whether we bounce here or bounce from somewhere lower like 1286, I do not think this correction (if that's what it is) is over. I think we'll touch the 100dma from underneath and then embark on potentially the last wave down;


On the shorter term basis, this is a 60 min 5 week chart. You can see here why I think we may bounce here besides being oversold. We closed right at the bottom of the short term channel on Friday. So it held support within the channel. If we lose that channel tomorrow, then obviously we have more work to do immediately to the downside;


Where this "correction" ends is critical. There are many possible longer term elliot wave counts. Taking out the 200dma would point towards calling the end of the rally from March 2009. Anything above the 200dma has the potential to again rally to yet new 52 week highs.

The financials are really waving their arms here yelling that there are major issues dead ahead. The XLF is not that far away from a potential death cross. It's much closer than any other index or sector. The market cannot rally to new highs with the financials tanking.

If the market is/has been rolling over, it will take awhile and it will be one step at a time. We are under the 50 and 100. Next is the 200. We have to get under the 200 to have the potential of a death cross (the 50 crossing under the 200). Even if we tank hard here, we are months away from a death cross. So these things take time to confirm.

Hope you all had a good weekend, GL tomorrow.

CJ

Thursday, June 2, 2011

06.02.2011 --- Mixed Signals

Obviously we are somewhat oversold here. The DOW is the most oversold, while the S&P and Russel 2000 do have some room. But oversold can always become more oversold. So that alone is never a reason to abandon a position or try to catch a falling knife in a bear move.

Not a whole lot changed from yesterday.

The DOW held the 100 today. Which is symbolically and psychologically important, but not super important because the DOW is only 30 stocks. The DOW though looks the most oversold and after holding the 100, looks the most ready for a bounce here;


The S&P on the 7 month daily chart looks to have broken and closed under the 100dma. Now, I don't know about you, but I think 500 stocks are more important than 30 stocks. So we have a mixed signal here;


On a shorter term basis, we appear to have closed just under some resistance in the middle of the channel. We could either take that out and head to the top tomorrow, or we could finish and head to the bottom. So short term is a 50/50 call here, not much better than roulette;


Not much changed for the Russel 2000 or XLF. Russel is still holding support and is still above the 100dma. The XLF is still floating around in no mans land below all moving averages.

What the bears really want here is for the Russel, S&P and DOW to all take out the 100, and then give the 50 and 100 some time to roll over and start heading south. We have a lot of ground to cover to converge the 50 and 100 with the 200 and we need the 50 to cross the 200 to get the dreaded death cross.

But one step at a time...

GL

CJ

Wednesday, June 1, 2011

06.01.2011 Update.. the bears are back...

Well.. yesterday looked like the bulls were ready to stampede and all signals were go. As mentioned yesterday, the bears had 3-4 days to get a violent reversal and erase those technical break outs.

The bears got their violent reversal.

So here we are back in almost the same place we were last Friday.

The S&P had a particularly nasty close, back below both moving averages and in a gaping hole of missing support. The 1 saving grace for the S&P is that it only closed SLIGHTLY below the 100dma and under trend support.

Looking deeper inside.. The XLF also had a very nasty close. I think we have another banking crash on the horizon. I have speculated why in previous posts, which revolves around the banks using much of their pervious loan loss reserves to pump earnings and at the same time the housing market is double dipping. That combination will put us directly back into the same position we were in during 2007-2008. I wonder if the banks have done so on purpose always believing that they will not be allowed to fail, therefore why reserve a bunch of our own money to get eaten by losses. Who would have thought the moral hazard of the bail outs might actually be moral hazards.

The Russel 2000 and IYR are in better shape but are not far from being in the same place as the S&P. Honestly, with the economic news we've had lately, I'm surprised the Russel isn't leading the way down here. IYR will continue to benefit from falling treasury rates. Occupancy rates will be key. I also suspect REIT's are quickly losing pricing power per square foot on typical 5 year lease renewals. 5 years means people who signed 5 year leases in 2006 during the boom and the good times are finally getting the chance soon to bounce out of those or re-negotiate them. REIT's will likely take a hit from that dynamic.

so here we are back to about where we were Friday with some ultra ugly candles.

Charts to warm a bears soul; (all are 7 month daily charts)

S&P


Russel 2000 (IWM)


The Financials (XLF)


Dow Jones Real Estate (IYR)


If we get a follow through day on the downside here between tomorrow and Monday the bears will really have something to hang their hats on.

The 200dma for the S&P is down around 1240. It won't be completely doomed for a lasting bear market without getting and staying under that. But a minimum pullback to that level is definitely on the table here, provided we stay under the 50dma.

GL

CJ