My 7 month old got hand, foot and mouth disease. Its a virus sort of like chicken pox, you only get it bad once. Its not fun. They cant sleep, so therefore, neither do you.
Short answer here for an update is that we are either on the verge of a breakout or breakdown.
There are quite a few arguments against breakout.
1) Volume is pathetic
2) Earnings have damaged quite a few previous growth leaders
3) Lots of divergences (DJT, Russel 2000, SOX) .. all lagging the S&P and DOW
4) Lots of falling RSI's on rising indicies
.. that said.. the market is basically ignoring anything negative. Anything negative just means more QE. Its all about flow... there's just a lot of money that needs to go somewhere. Central banks around the world and just crapping money and it has to be put somewhere. Always remember that cash is a liability on a bank balance sheet. Even if the investment earns negative return, think Swiss T-bonds which have a negative yield, it's better than having cash for the bank because it's still considered an asset on the balance sheet even at a negative yield. (which is kind of stupid btw) but this is a new world and a new situation with new rules.
I'm not going to bother posting a chart tonight. My focus is not on super short term movements anyways.
1422 is a line in the sand here. After 1422... flow takes over and just massive amounts of money that needs to go somewhere other than cash could push this thing to new all time highs. Even when you have Rosendickbag on TV saying they should do endless QE.
This is a mess folks. It really is..
You have insane monetary policy pushing money into assets with a economy that refuses to respond and the money that should be driving inflation higher to stop the insanity, is doing nothing except driving stocks, PMs and energy prices higher.
Guess what... stocks, PM's and energy are not in the calculations for inflation measures.
We could totally crash sometime soon... or we could end up with the S&P at 1600, Gold at 2500, and Oil at 175$ a barrel.
Japan is our only reference for what might happen going forward here... but their situation was just different. So much so, that I don't think it can serve as any frame of reference for what will occur here.
Long story short... we can go to new highs... or we can crash. Either way... over a long period of time... nothing good will come of whats happening now. It will be all bad.
I predict right now that 95% of people currently in their 30's and younger (and some in their 40's) will never retire and be destitute in their "golden" years. 30 years from now the US will be full of poor old people. Very different from now. The US will ultimately resort to what many asian countries do. The grandparents (those in their 30's now) will move back in with their children to raise their childrens kids while their kids work. Not completely by choice but mostly out of necessity for both parties.
I formally declare this market and country as being FUBAR'ed.
GL
CJ
Wednesday, August 8, 2012
Thursday, August 2, 2012
08.03.2012 -- Short term pivots
Today confirmed what I suspected, and the last chart in yesterdays post is significant. I finally figured out what pivots/trends that this short term move is using.
Not much else to add really except that it still feels like the PPT is involved here, likely due to the elections coming up. Obama certainly does not want a market falling apart into November, so much will be done behind the scenes to keep it as presentable as possible. With so much poor economic news, downward GDP revisions, Spainish and Italian bonds falling apart again, the FED disappointing.. certainly didn't expect to see the S&P still sitting at 1368 after all that. Even add on top the general loss in market confidence with the Libor scandal and Knight Capital HFT SNAFU.
Anyways.. here's the short term pivots/trends to watch. Until these are broken north or south, we will just bounce around inside them.

Wednesday, August 1, 2012
08.01.2012 - 1368 first stop
No real change from yesterday. Not a lot of market movement.
I will say though, there are some important sectors that have been underperforming the entire ramp and this selloff.
Today for example, DOW down 37, S&P down 4.
The NAS was down 19 or .66%, the Russel 2000 was down 1.65% and the DOW Trannies were down 2%.
The only area that seems to be doing o.k. that is a growth indicator is the SOX.
Next movement is still up in the air... but we at least appear to be targeting 1368 before the next movement decision;

Was messing around and these also look like important trend lines short term;

Tuesday, July 31, 2012
07.31.2012 - Dual pattern..
So, I tried to make sense of the short term chart. The SPX hourly over a 10 week period. I couldn't make heads or tails of it, which is pretty rare. Usually I can find a dominant pattern, but its just chaos. There's no less than 10 different channels, wedges, megaphones, etc. that you could make on it. So for now, I'm just avoiding it. Short term, I have no idea whats going to happen.
I did find something of interest though in the daily and weekly charts.
The Daily chart ( 7 months ) and Weekly chart ( 7 years ) are sporting the exact same pattern. It's actually quite striking how similar they are.
The only problem is that both patterns are at the same exact point in their development. So there's nothing to foreshadow.
What I can say though, is whatever happens next will be confirmed in all 3 longer term timeframes. The Monthly, Weekly and Daily. Because they are all sporting the same pattern.
Here they are;

Sunday, July 29, 2012
Weekend update
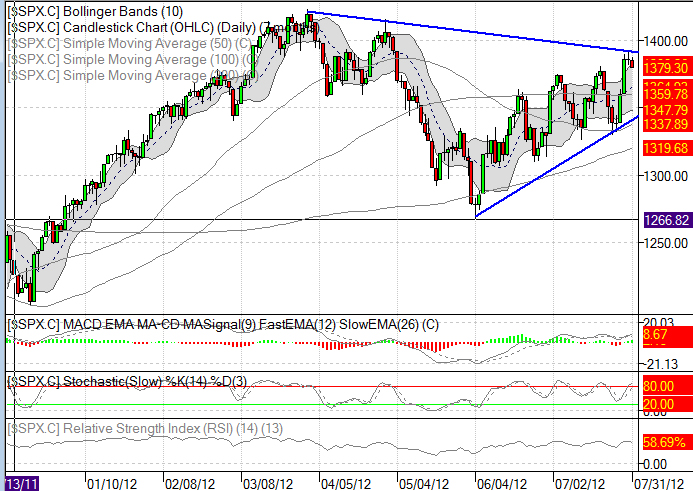
The following chart will pretty much show everything that needs to be shown right now for the short term. If the S&P gets past 1402, we'll be heading for new highs and potentially all time highs through the election.
There are still lots of reasons on the longer term charts to think this is a fake out though. Including all the Daily, weekly and monthly charts for the S&P rising with a falling RSI for quite awhile now.
But for now, Friday was a strong day, lots of growth stocks (like AMZN??) powering ahead.
The market obviously believes we are going to get a strong round of Fed intervention soon.
Heres the short term chart (SPX hourly)

Thursday, July 26, 2012
07.26.2012 -- Trading N stuff
Things are settling down with my newest family additions and I'm going to get this going again, however, it will be in a shorter format than my previous posts with less commentary except maybe a commentary only post over the weekend.
Since this is the first post in awhile, I will do a quick update here.
Lots of growth leaders are breaking down while this market still feels like it wants to break higher. Growth stocks, especially ones that have been hot, are getting hammered on missed earnings. FB, NFLX, CMG, ZNGA to name a few have gotten seriously pounded. 20%+ smashings.
The market is stuck between QE3 expectations and worsening economic data. The close today was very interesting. Most would have guessed that we rallied handily back into previous wedges and back over support lines. This actually doesn't appear to be the case. It looks like a back test. The following charts are SPX cash in 3 timelines.. Weekly, Daily and Hourly. The daily and hourly show how we appear to have completed a backtest at the moment unless we manage to have another decent day tomorrow.
Charts;


 The market still has issues here.
GL
CJ
The market still has issues here.
GL
CJ
Since this is the first post in awhile, I will do a quick update here.
Lots of growth leaders are breaking down while this market still feels like it wants to break higher. Growth stocks, especially ones that have been hot, are getting hammered on missed earnings. FB, NFLX, CMG, ZNGA to name a few have gotten seriously pounded. 20%+ smashings.
The market is stuck between QE3 expectations and worsening economic data. The close today was very interesting. Most would have guessed that we rallied handily back into previous wedges and back over support lines. This actually doesn't appear to be the case. It looks like a back test. The following charts are SPX cash in 3 timelines.. Weekly, Daily and Hourly. The daily and hourly show how we appear to have completed a backtest at the moment unless we manage to have another decent day tomorrow.
Charts;


Wednesday, March 14, 2012
03.14.2012 -- Blow off top?
Last time I posted, I went over how the market had to make a decision and the decision was made to move higher and we have now broken the rising wedge to the upside.
This, IMO, is a classic blow off top with a false breakout. This is what I wanted to see. Finally.
----------------------
Key Levels
Upside -- 1400, 1450?
Downside -- 1391, 1373, 1354, 1335, 1286, 1260
----------------------
SPX Daily;

So obviously the market feels really bullish right here, so lets go over some of the hidden things that are bearish.
1) First move is usually wrong. That is the underlying premise of our fake breakout higher and blow off top.
2) You can see in the chart that the RSI and MACD is declining while the S&P is putting in a powerful move north. That is a bearish divergence.
3) Yesterday the Transports tried to make a move north and got back over the 50DMA.. that reversed heavily today and is back underneath the trannies greatly underperformed today. This is still a DOW theory non-confirmation, which is bearish.
4) Sentiment is getting extremely bullish with things like CNBC having an "analyst" on this morning that when asked, essentially said he was buying pretty much anything and everything.
5) The financials were trying to stage a breakout yesterday. Today the XLF closed flat.. but the internals were quite mixed.. with some stocks like Citi and Goldman Suchs taking a big hit and others like BAC rallying hard. The XLF was very bi-polar today.
I know it doesn't seem like it, but something ugly is about to come out of the woodwork here soon. It could be that housing prices start tanking again with rates looking like they've put in a long term bottom. I still believe there are simply more houses than people to occupy them and it will remain a fundamental problem for the housing market. It could also be when the CDS trigger on Greek debt is pulled. It could be a large country like Spain or Italy that suddenly starts spinning the toilet bowl... but it will be something and soon.
GL
CJ
Thursday, March 8, 2012
03.08.2012 -- Decision time..
So we did what I expected in my last post, we broke, we are now backtesting. Believe it or not, it took the last 2 days of rallying to backtest the old trendline.
--------------------------
Key Levels
Upside -- here to 1374
Downside -- 1325, 1320, 1279, 1259
Again still at a point where 110 S&P points breaks all support.
--------------------------
SPX Daily;

So pretty clearly you can see the break below the trendline and then now the perfect backtest.
We either break back into the wedge now and most likely put in another round of new highs, or we will fail right here.
If we fail right here, I suspect we will test the full bounderies of completely falling apart which would be the lowest moving average which currently sits at 1259 and rising. Below that, the market has a real problem on its hands.
its pretty much do or die for at least 50 points here, the break higher must happen tomorrow if its going to do it. Either that, or it would need to be a very narrow range day and explode up on Monday.
Otherwise, i expect us to re-fall hard here soon.
GL
CJ
--------------------------
Key Levels
Upside -- here to 1374
Downside -- 1325, 1320, 1279, 1259
Again still at a point where 110 S&P points breaks all support.
--------------------------
SPX Daily;

So pretty clearly you can see the break below the trendline and then now the perfect backtest.
We either break back into the wedge now and most likely put in another round of new highs, or we will fail right here.
If we fail right here, I suspect we will test the full bounderies of completely falling apart which would be the lowest moving average which currently sits at 1259 and rising. Below that, the market has a real problem on its hands.
its pretty much do or die for at least 50 points here, the break higher must happen tomorrow if its going to do it. Either that, or it would need to be a very narrow range day and explode up on Monday.
Otherwise, i expect us to re-fall hard here soon.
GL
CJ
Monday, March 5, 2012
03.05.2012 -- Potential roll over..
As a side note, I am finding it harder and harder to make the time to do these with our 2 month old and our 2 year old right now, so they may not continue to be 4-5 days a week and might just be 2-3 days a week for a little while.
Moving to the markets.. i think we have a rollover in process. The outstanding question is what kind of top it is. The power of the eventual selling will help answer that question.
------------------------------
Key Levels
Upside -- 1366-1377
Downside -- todays low to 1360, 1319 (big drop to next support), 1275, 1258
------------------------------
SPX Daily;

So you can see there what happened today. We sold back into the wedge, which qualifies as a false break north, but would have liked to see a bigger blow off. After falling back into the wedge we fell to the bottom of it and then bounced and closed back in the bollingers.
I think within the next few days, we will again test the bottom and break lower out of it. Which will produce (after a possible back test) at least a 50 point S&P selloff just to start.
Could we have a fake out here and THEN complete a final surge that is the real blow off I was looking for? Yes.. its possible. But if we break convincingly below this wedge on close, that will be it for the rallying for awhile.
---------------------------------
Lots of rotational selling going on right now. The Russel 2000 and Transports were very weak last Thursday/Friday while the market tried to hold its own and stocks like Apple still closed green. Today the Russel held up o.k. while Apple sold off hard and sent the NAS down hard.
Right now.. the Russel 2000, Transports and SOX are being a drag on the market. Leadership had really narrowed and we have parts of the market starting to show cracks in the armor.
The trannies, Russel and SOX are especially important as a group. The Trannies failed to reach a new high and therefor have a non-confirmation of a DOW Theory buy signal. A non-confirmation is bearish. The SOX is important becuase its the semi-conductors and they often lead during bull markets as strength in manufacturing shows up and chips are needed in so many products. The Russel is important because it represents small business in America and generally is a better represention of the local economy and not so much how our economy is benefiting from the debasing of our currency and government deficit spending.
Without those three sectors also participating and hitting new 52 week highs with the S&P and DOW, it's really a bearish divergence in the market.
GL
CJ
Wednesday, February 29, 2012
02.29.2012 -- Reversal?
Today was a miniture version of what i've been waiting for. We broke the upper trendline of the wedge intra-day and then proceeded to sell off and close red.
I would have liked to see a bigger blow off and a larger reversal, but today could qualify.
So far, I would say this appears to be another pullback (which we havent seen in awhile) and then yet another ramp sometime before a sell in May event. We will see how the trading goes if a sell off occurs here. A major top will involve major selling.
--------------------------------
Key Levels
Upside -- Here to about 1375
Downside -- 1361, 1354, 1310, 1300, 1269, 1258
--------------------------------
SPX Daily;

Here are all the potential support areas. It's interesting how the trendlines end up so closely following the moving averages right now.
Even though the market didn't end down a ton, there was some heavy selling in areas of the market. The Russel 2000 again got hammered. The Russel is one of the areas that was still a big move away from new highs.
AAPL was up 1.3% but the NASDAQ was down 20. That tells you most things were hammered pretty good and AAPL kept it from looking real ugly. Probably done on purpose.
Early next week is a phi mate turn date. So this could be just another fake out, but those dates are +/- a few days, so today may have been it for at least a couple weeks.
-----------------------------
Bernanke was probably not happy about the reaction to his speech today. By downplaying QE3, his intention i'm sure was to hammer oil prices back down. Knowing that in doing so, he might ding the market and knock treasury prices down.
Well.. he spoke.. market didn't like it, treasury prices sure enough headed lower, but oil held steady at 107. Oooohh.. i bet that burns his ass.. hahahha.. he is pissed tonight I think.
He did though manage to beat down the precious metals. But in the end, precious metals probably don't matter a whole heck of a lot to him, but oil does.
It really is sad.. I can't stand Ben Bernanke and everything he stands for, but at the same time, I know that the downfall of what he's created will mean terrible things for this country and my own children. In the end though, what he's doing has no other outcome, it is unavoidable, the outcome can only be delayed. I'd much prefer to get it over with now.
GL
CJ
Tuesday, February 28, 2012
02.28.2012 -- on the edge..
Don't have a ton of time today, so will just get right to it. The S&P is right on the edge of new highs. The NASDAQ is already there.
BUT.. odd divergences. The DOW Transports were down today and are over 10% from new highs. While at the same time the DOW has hit new 52 week highs. Thats a big Dow Theory non-confirmation. Probably never seen the Trannies lag by 10% like that.
The Russel 2000 is also nearly 5% off of new 52 week/all time highs. The Russel today was down and was trading like an anchor to the market all day.
The NASDAQ had a nearly even Advance/Decline print today, despite the NAS being up 20 points. I believe this is all Apple all the time.
Leadership is very narrow.
They are attempting to rally the financials and light the spark to send us to new highs on the S&P,... BUT.. even if we do, we still have the Russel 2000 and probably more importantly the DOW transports a very good clip off new 52 week highs, which will remain a big divergence and DOW theory non-confirmation.
The market at or approaching 52 week highs and some indicies like the Russel 2000 near all time highs.. I cannot believe that the 10 year yield still sits at 1.92%. The amount of liquidity to pull off new market highs and all time record low yields is staggering.
God help us all if inflation sets in. There's no one in the FED that has a rats ass chance in hell of stopping it.
Anyways.. no time left..
SPX Daily;

Thursday, February 23, 2012
02.23.2012 -- More of the same..
Nothing much changed today. We bounced off the mid-bollinger bands yet again and are continuing to ride up the top of the wedge.
------------------------------
Key Levels
Upside -- 1360-1370
Downside -- 1354, 1347, 1310, 1298, 1257
support continues to rise while the market is stalling and gyrating. We are now at the point that a 105 point sell off in the S&P would put the market below all support.
------------------------------
SPX Daily;

Not much to add today from our recent view. We continue to ride up the top of the wedge. We bounced off the mid-bollinger bands yet again which of course resulted in another trip to the top of the wedge.
We have a shot here to get a false break higher out of this wedge and then I would wager a collapse would be right behind it.
One change that I did not mark is that I think the EW count has changed for this particular rally that began just before christmas. It appears it is a wave structure in which we have a very large first wave, a much smaller 3rd wave and we are now in wave 5. I believe wave 5 is a micro copy of the entire structure. If so, there are 2 very small waves left.. a very small sell off and then one more very small lift. Under that count, that would complete the rally.
If my current count is right, I would guess sometime around next Wednesday could be a target for the end of this, but as usual EW counts can morph and can vary quite a bit from person to person attempting a count. Its not a primary indicator for me, but it does at the moment match all other technicals that this rally is nearing a major end.
GL
CJ
------------------------------
Key Levels
Upside -- 1360-1370
Downside -- 1354, 1347, 1310, 1298, 1257
support continues to rise while the market is stalling and gyrating. We are now at the point that a 105 point sell off in the S&P would put the market below all support.
------------------------------
SPX Daily;

Not much to add today from our recent view. We continue to ride up the top of the wedge. We bounced off the mid-bollinger bands yet again which of course resulted in another trip to the top of the wedge.
We have a shot here to get a false break higher out of this wedge and then I would wager a collapse would be right behind it.
One change that I did not mark is that I think the EW count has changed for this particular rally that began just before christmas. It appears it is a wave structure in which we have a very large first wave, a much smaller 3rd wave and we are now in wave 5. I believe wave 5 is a micro copy of the entire structure. If so, there are 2 very small waves left.. a very small sell off and then one more very small lift. Under that count, that would complete the rally.
If my current count is right, I would guess sometime around next Wednesday could be a target for the end of this, but as usual EW counts can morph and can vary quite a bit from person to person attempting a count. Its not a primary indicator for me, but it does at the moment match all other technicals that this rally is nearing a major end.
GL
CJ
Wednesday, February 22, 2012
02.22.2012 -- Tired..
Is the rally tired? yeah.. its real tired. Its like a bullet shot straight up in the air that's just about stalled.
You know whats more tired than the market? Me. I'm so sick and tired of the lies and bullshit that comes from the so called leaders of this country.
Here we are in election year and what are the headlines coming from our "leader" and potential "leaders"? Corporate tax reductions and closing some loopholes and lower the top bracket tax rate to 28%.
We are running trillion dollar deficits and these assholes are flapping their mouths about lowering taxes.
It's become nothing but a contest about who can promise the most bullshit not about who can fix problems and actually be a leader.
Apparently this country is so full of morons that they will elect a snake oil salesman over and over and over again.
To be honest, I don't like any of the choices. I think they all suck. I think the founding fathers are rolling over in their graves.
------------------------------------
Key Levels
Upside -- 1360-1370
Downside -- 1352, 1342, 1300-1296, 1257
------------------------------------
SPX Daily;

Same wedge we've been following. The bollingers though are starting to flatten out here, which is always a pre-cursor to turning down. Doesnt have to be a trend change, but the bollingers will always flatten before a trend change.
The interesting part about it this time is that the bollingers are flattening while we are still riding above the top of them. That's a set up for a big sudden fall that goes right through them with first support being just above 1300.
The market is obviously tired here. The only question again is what kind of selloff we get when it comes.
If we get a mild selloff that eats up time but not much % off the S&P, then there's likely another ramp coming.
If we get a very impulsive and powerful selloff, then questions will be asked about whether we've already seen the highs for the year.
GL
CJ
Tuesday, February 21, 2012
02.21.2012 -- 4 dollar gas and counting..
Oil broke recent highs.. nothing really stopping it now from surging back to 150 again. Except this time, 150 WTI will mean 6-7$ a gallon at the pump.
It's world economies heating up.. yeah thats it.. thats the ticket.
It definitely doesn't have anything to do with trillion dollar deficits, ZIRP and massively increasing FED balance sheets. Nope.. not that.
-------------------------
Key Levels
Upside -- here to 1370
Downside -- 1351, 1345, 1300, 1294, 1257-1250
A close below 1345 will be short term bearish and will mean a test of 1300 for sure.
------------------------
SPX Daily;

Here is our continuing rising bearish wedge.
This thing will break one day. The question is whether we get significant new highs in all indicies before doing so.
Right now, we have a significant new high in the NASDAQ and DOW. However, per DOW theory it is a non-confirmation with the Transports as they have not made a new significant high and actually deteriorated today. Also on the divergence side, the S&P, Russel 2000 and Wilshire have yet to make significant new highs.
It is possible still that we still have one more trip to the bottom of this wedge and yet one more surge to attempt to reach the pinnacle of it. That would work time wise, as we will be entering that late March/April timeframe where sell in May becomes a factor. But the next move down could be it too.. its all going to be how the market trades the next down move.
GL
CJ
Thursday, February 16, 2012
02.16.2012 -- Still rolling over?
We had a new high in the S&P by less than a point and a new high in the NASDAQ today, but I still believe this is all part of a topping process and probably a larger topping process.
Tonights chart will show you exactly what happened today.
------------------------
Key Levels
Upside -- here, 2370
Downside -- 1345, 1300, 1290, 1257, 1250
------------------------
SPX Daily;

heres our latest chart again. notice how we hit the bottom of the bollingers, which was last support until a fall to 1300, and then bounced right back up to the edge of the rising wedge. That is where the market sat pretty much the rest of the day.
so we have a new high in the SPX and in the NAS, but in the end, we still have a DOW theory non-confirmation with the trannies not making new highs yet and we are still within our rising wedge and have not broken out of it.
i suspect we'll ride the top of the wedge or maybe have a false breakout of it here for OPEX.
we may not though.. in the past it has not been unusual for the market to choose a day like OPEX to fall apart at major tops. I just don't think we are quite there yet. We need more selling to creep in and volitility to rise and then AFTER that happens.. probably another run to make people think we are going to rally again after consolidating and that is the point where it can all fall apart.
as long as the S&P, IWM and Trannies arent making new highs.. we have divergences in the market including a DOW theory non-confirmation that are screaming things are not well.
GL
CJ
Wednesday, February 15, 2012
02.15.2012 -- What kind of top is this?
We are putting in a little top here. The question is how large this top becomes.
Is this just a little top of the rally since 12/02? in which case the bottom of the rising wedge will likely be the low target or will this become a larger and larger top as more and more support breaks?
Don't guess, just let it tell you. First stop is the bottom of the wedge in todays chart. That rests slightly above 1300 at the moment but rises daily. Then all 3 major moving averages are sitting within 50 points of the bottom of the wedge.
The market is set up in a way right now that a fast 100 point sell off would slam the market below all support. But, lets see support lost first.
This is now a good spot to be short with the recent highs as stop loss and watch the support levels.
---------------------------------
Key Levels
Upside -- 1353, 1370
Downside -- Here, 1337, 1300, 1288, 1257, 1249
---------------------------------
SPX Daily

Theres the wedge and our little rollover is sitting on very first support at the mid-bollingers and previous resistance at the shoulders of last years big H&S pattern.
If the move since last October is an ABC move, then we could be done. If its a 5 wave move, we are probably starting wave 4 down to the bottom of the wedge and then one more rally north to complete the count.
There's really no way to know which it is other than watching the support and how the market trades. If we are indeed done with this entire move, we will spend some time putting in a larger top and then the selling will hit super fast and furious.
The market has created a large amount of optimism and hype here, so if it is going to be a major top, it's going to take some time to build a larger top.
GL
CJ
Thursday, February 9, 2012
02.09.2012 -- still bleeding higher..
In tonights chart, I threw in what I think is now a completed EW count.
There are other options, but this looks like a clear complete count. To be proven wrong, 1370 needs to get taken out.
I dont normally use EW as a major indicator, but I use it when it is supported by all other technical indicators.
In this case, it is supported by the daily Stochs, MACD, trendlines, timing, and sentiment.
----------------------------
Key Levels
Upside -- here to 1370
Downside -- 1348, 1332, 1317, 1290, 1279, 1257, 1242
----------------------------
SPX Daily;

Here's the labeled count and where we stand. We are essentially just sliding up the upper trend line as it rises each day, so we are rising slightly continually to new recent highs but without breaking resistance.
This is pretty self explanatory, so i'll move on.
-------------------------------
I think most of you who read this blog know that we are heading in a direction that will ultimately lead to bad things. We just don't know how long it will take to get there.
We are essentially blowing a bubble in global central bank balance sheets.
How far that can push markets is anyones guess.
It certainly would qualify as by far the largest and most insane bubble to ever be created.
In the end, trying to predict it seems silly though.
Will anyone even ever know that you were the one to call the collapse as the world sinks into a global depression caused by a soverign debt and central bank balance sheet bubble?
A global central bank and sovreign debt bubble is not a tech bubble or a housing bubble. It will be a global bubble and a devastating bubble. If you had the choice between global nuclear war or global exploding soverign debt bubble, I just might choose nuclear war.
-----------------------------
Some numbers..
I think some folks lose sight quickly of how large these numbers have become. 7 or 8 years ago, throwing around numbers like 50 billion would have been enormous. The 400 billion deficit under Bush seemed tremendously huge.
These numbers have gotten so enormous they are leaving comprehension for most.
Lets talk for one minute about one number in particular. Lets assume for a minute that the IMF hands over 50 billion dollars to help bail out Greece yet again.
Now lets assume that the 50 billion is funded mostly through US tax payers.
Keep in mind too, 50 billion is less than 1/20th! of last years fiscal deficit.
50 Billion is equal to approx. 160$ for every man, woman and child in the United states of America.
If you have a family of 4, giving Greece 50 billion is like taking 640$ out of YOUR wallet and handing it to Greece. You may not feel it now, but you will in the future when this money must eventually be paid back.
Now compound that into our fiscal year deficit.
The US Treasury borrowed, in excess of tax revenue, the equivilant of over 3500$ for every man, woman and child in the US last year.
Or over 20x the 160$.
So a family of 4 is on the hook for 14000$ in accumulated national debt for last year.
We've done this for 3 years in a row now.
In 3 years, we are on the hook for 42K dollars per family of 4 in just 3 years.
This is just borrowed debt in excess of tax revenue.
Obviously Bernanke keeps mentioned how fiscal policy must be addressed, yet at the same time, he continues to allow them to spend uncontrollably by keeping borrowing rates at zero.
But think of it like a mortgage.. even if your mortgage rate was zero, you still owe money every month on the balance.
Then lets say you have a 300k mortgage at zero percent interest. You pay 1100$ a month, it comes straight off the principal. BUT.. at the same time that year, you take out a home equity loan for 10x the amount of principal you paid off that year. So you paid off almost 15k, but took out another loan for 150k. Now you owe 450k next year. Rinse repeat. This is what the government is doing. This is what governments around the world are doing.
This is unsustainable.
We will either see treasury rates blow up on us or government spending must be drastically reduced.
Either way, the economy will be harmed badly.
This is the essence of this bubble. The worst we have ever seen.
GL
CJ
Wednesday, February 8, 2012
02.08.2012 -- 21 points
We are 21 points from new multi-year highs on the S&P. If the bears longer term EW count is ultimately correct, the rollover must occur soon. It wouldn't destroy the bear thesis if we take out 1370, but we would have to back way up in the EW count and targets well into the upper 1400's would become possible.
----------------------------
Key Levels
Upside -- Here, 1370
Downside -- 1344, 1329, 1314, 1275, 1257, 1241
----------------------------
SPX Daily;

Again, not much change. We are doing what I said was necessary to drag this out. Which is close within a small range each day. +/- 3-4 points at most. How long can the market keep that up? I don't know, but I would guess not much longer.
The MACD is up to 19.73. Moved a little higher. 24 is that magic number we have never crossed on the daily. And the previous times we have gotten that high were all major reversals.
We just have to wait and see what happens. If 1370 gets taken out on a close and stays there for a couple days or more, there will be some big changes to a lot of EW counts floating around out there. It wouldn't kill the bear case long term, but could provide the open door to move prices another 100 points higher.
GL
CJ
----------------------------
Key Levels
Upside -- Here, 1370
Downside -- 1344, 1329, 1314, 1275, 1257, 1241
----------------------------
SPX Daily;

Again, not much change. We are doing what I said was necessary to drag this out. Which is close within a small range each day. +/- 3-4 points at most. How long can the market keep that up? I don't know, but I would guess not much longer.
The MACD is up to 19.73. Moved a little higher. 24 is that magic number we have never crossed on the daily. And the previous times we have gotten that high were all major reversals.
We just have to wait and see what happens. If 1370 gets taken out on a close and stays there for a couple days or more, there will be some big changes to a lot of EW counts floating around out there. It wouldn't kill the bear case long term, but could provide the open door to move prices another 100 points higher.
GL
CJ
Tuesday, February 7, 2012
02.07.2012 -- Tick tock..
Not much change from yesterday, except I might expect us to pop up about 6 points from here just to touch the trendline and then reverse, but we don't have to.
-----------------------------
Key Levels
Upside -- right here, 1350
Downside -- 1340, 1327, 1314, 1283, 1272, 1257, 1239
still very lopsided
----------------------------
SPX Daily;

Not really any changes. We started to sell off, touched the top of the bollingers and then bounced right back up into that small soft range we can stay in until something breaks.
The MACD is up to 19.26.. 24 is the magic max of the last decade. So there is room, but we've only made it to 24 3 times in the last decade.
The Stochs are also back up to max overbought.
Volume has been extremely low lately, as was noted by Zerohedge, the volume yesterday was the lowest relative volume of the last decade not including holidays.
tick tock..
GL
CJ
Monday, February 6, 2012
02.06.2012 -- Dump or break out?
We are sitting at a lot of resistance here and there's really only 2 choices for the market. We either dump or get a big breakout (that I think will ultimately be a false one).. and that will happen very soon. Like tomorrow. There's just no time left.
I supposed we could go nowhere all week.. stay in a 3-4 point S&P range the entire week.. that's what would have to happen to last to the end of the week, but I just don't see that happening.
-----------------------
Key Levels
Upside -- Right here, a few points higher around 1350
Downside -- 1327, 1320, 1310, 1288, 1268, 1257, 1238
support spread back out so that its very lopsided,.. a sign of a possible imminent reversal
-----------------------
SPX Daily;

You can see how we are butting right up at resistance here. We've tested it twice now since Friday. There just isn't time left here.
Not much else to say here.. something is happening soon.
GL
CJ
Thursday, February 2, 2012
02.02.2012 -- still waiting
Again nothing changed from yesterday. The Russel and Nasdaq finally broke their short term parabolic moves, which IMO had been supporting the market the last couple days. The NAS has been up big while the S&P and DOW are just kinda watching and getting pulled along behind.
------------------------
Key Levels
Upside -- Right here, 1340-1345
Downside -- 1310, 1287, 1257, 1234
------------------------
SPX Daily (12 month)

Closed under the trendline yet again. One of these days we are either going to bust higher and have a blow off top, or we are going to reject this key level (which I expect) and we'll see what kind of sell off we get from it.
Running back up to near the top has not done much to the Stochs or MACD. The stochs have a very small roll back up, but they are below that overbought level that could keep it running, they look ready to just roll back over again.
Something will happen soon, I think we will all at least welcome a resolution to this move.
GL
CJ
------------------------
Key Levels
Upside -- Right here, 1340-1345
Downside -- 1310, 1287, 1257, 1234
------------------------
SPX Daily (12 month)

Closed under the trendline yet again. One of these days we are either going to bust higher and have a blow off top, or we are going to reject this key level (which I expect) and we'll see what kind of sell off we get from it.
Running back up to near the top has not done much to the Stochs or MACD. The stochs have a very small roll back up, but they are below that overbought level that could keep it running, they look ready to just roll back over again.
Something will happen soon, I think we will all at least welcome a resolution to this move.
GL
CJ
Wednesday, February 1, 2012
02.01.2012 -- Today did not change anything..
Today felt bullish and likely had some bears on the edge of their seat as to when or if a pullback at least may ever come.
But, when you look at it technically, no key levels were broke on close and nothing really changed from what I said yesterday.
--------------------------
Key Levels
Upside -- 1325, 1340-1345
Downside -- 1310, 1282, 1257, 1232
--------------------------
SPX Daily (12 month)

As you can see here, nothing really changed today. While having a small breakout intra-day, the market closed inside the bollinger bands and below resistance.
The Stochs and MACD did not budge, they are both still indicating a rollover is imminent.
Not much else to say here besides wait for it. I still believe a big down day is in the works here in the next few days.. maybe tomorrow, but more likley by Monday/Tuesday.
GL
CJ
Tuesday, January 31, 2012
01.31.2012 -- About to see where we stand...
We are still fighting inside the bollinger bands, but they are very narrow. The stochs have continued to slide and usually the market plays some catch up when that happens.
---------------------
Key Levels
Upside -- 1315-1325
Downside -- 1300, 1257-1270, 1231
---------------------
SPX Daily (12 Month)

We are bouncing around inside those thin bollinger bands. This is just a rollover process of wearing down support. Certainly feels like bears will get burned by the numbers you see everyday, but I don't think that's the case.
The stochs have continued to decline and look to be ready to take a quick dive. The market usually plays some catch up, so I expect some sort of fairly hefty decline here soon within a few days.
The MACD is still way up in very overbought land. The sell off, once started, will not be over utnil the MACD is at least close to zero from its current level of near 17.
We should finally be able to come to conclusion as to what we are dealing with and where we stand soon as the power of this next decline will tell us a lot about this market.
-----------------------------
A lot of money piling into treasuries lately. Have you watched the 10 year yield?
I know that Bernanke has said what he said and that is a contributing factor, but think about it.. if this was such an economy on the verge of really entering a strong part of a recovery, would people be dumping tons of cash into 10 year treasuries that yield 1.84% over 10 years.
no... 1.84% over 10 years means I just want my money back.
A strengthening recovery and stock market surging to 1450 by year end does just not jive with the amount of money piling into treasuries at these rates.
We should know a lot more soon.
GL
CJ
---------------------
Key Levels
Upside -- 1315-1325
Downside -- 1300, 1257-1270, 1231
---------------------
SPX Daily (12 Month)

We are bouncing around inside those thin bollinger bands. This is just a rollover process of wearing down support. Certainly feels like bears will get burned by the numbers you see everyday, but I don't think that's the case.
The stochs have continued to decline and look to be ready to take a quick dive. The market usually plays some catch up, so I expect some sort of fairly hefty decline here soon within a few days.
The MACD is still way up in very overbought land. The sell off, once started, will not be over utnil the MACD is at least close to zero from its current level of near 17.
We should finally be able to come to conclusion as to what we are dealing with and where we stand soon as the power of this next decline will tell us a lot about this market.
-----------------------------
A lot of money piling into treasuries lately. Have you watched the 10 year yield?
I know that Bernanke has said what he said and that is a contributing factor, but think about it.. if this was such an economy on the verge of really entering a strong part of a recovery, would people be dumping tons of cash into 10 year treasuries that yield 1.84% over 10 years.
no... 1.84% over 10 years means I just want my money back.
A strengthening recovery and stock market surging to 1450 by year end does just not jive with the amount of money piling into treasuries at these rates.
We should know a lot more soon.
GL
CJ
Monday, January 30, 2012
01.30.2012 -- Pull back, surge, crash...
The stochs and MACD are starting to roll over. Looks like our last pullback is starting, although we may attempt one more run at 1320 here.
I believe the pullback will target about 1280, or wherever the rising trendline is at the time that we get there. Then we will experience our last short burning surge that will most likley be a false breakout over 1326.
------------------------
Key Levels
Upside -- 1315, 1325
Downside -- 1300, 1271, 1257, 1230
odd.. we down to only 4 areas of downside support..
------------------------
SPX Daily (12 Month)

MACD and Stochs are rolling over. What felt today like a bear trap was really just the market bouncing off the bottom of the bollinger bands. By the look of the futures, it appears we are going to make a small run at 1320 again, but I wouldn't be surprised at all if the green in the futures turned red over night because the market is primed and ripe for it right here.
I've also outlined our likely path. The 50 and 100 DMAs will be key here. If we get back under those, then there may not be one last surge, but I think there will be. There just hasn't really been that hardcore short burning push north with the reversal (usually intra-day) that is so key to putting in tops.
We should be in the sauce by end of March, if we aren't already starting.
GL
CJ
Wednesday, January 25, 2012
01.25.2011 -- We are there..
But.. I think we are going to have a fake break out here higher. 1340-1350 target area.
The best EW count leaves room for a minor sell off and yet another ramp higher, so we could reverse as early as tomorrow and sell off mildly for a bit and then finish the ramp to the false breakout. We don't have to though. But IMO, we need a blow off fake breakout here to complete this rally. Just touching a trendline is likely not enough here.
--------------------------
Key Levels
Upside -- 1327, 1344
Downside -- 1318, 1306, 1294, 1270, 1252-1257, 1226
* of note here.. the bottom of the very old trangle is rising fast, a sell off of only 100 S&P points right now puts us below all major support
---------------------------
SPX Daily (12 month)

So here we are, we hit the trendline today. That may be enough for a smaller pullback, that would push us down to the rapidly rising bottom of this wedge, or we can go ahead and breakout north in what I believe would be a false breakout.
To be proven wrong, the S&P needs to put in a new 3 year high above 1376. The DOW and NASDAQ would likely be at highs already by the time the S&P took out 1376, so it would basically confirm it along with the Wilshire most likely as well.
We are almost at 20 on the MACD.. magic long term number is 24 for extreme rallies. Extreme sell offs have always followed after the daily MACD made it to 24.
Its getting harder and harder to see what will stop this market. I'm sure quite a few people who are short are bailing right now. Those are all signs the top is near.
-------------------------------
If you wonder why Bernanke would commit the FED to keep rates near ZIRP for almost 3 additional years. 3 more years!!.. think about that relative to the past, those who have been around long enough. The old cycle would involved several lowering of rates in quick succession, then followed by a pause and then when the economy picked up, very little time was wasted in beginning a campaign of raising rates into the improving economy until it either became obvious they moved too slow with raising rates or they moved too fast. Usually the beginning of rate raises came within 6-10 months of a market bottom.
We sit now at S&P 1330, the DOW within 60 pints of 3.5 year highs and within 17% of all time highs, and we have the chairman of the Federal reserve basically throwing out any chance of a rise in rates for 3 years!.. thats almost an entire business cycle! of what used to be normal business cycles.
I have to think that you look no further than Europe for the reason why. The only conclusion you can came to is that Bernanke knows that the Europe situation is not solvable in the long term and that only 2 things can happen as an outcome and they are both bad and both will hurt the global economy. He must see it as a minimum of a 3 year process.
I'll tell you what though, if inflation does pick up suddenly.. hes in big big big big trouble.
I think the risk that still exists for S&P 350, is defaulting debt in Europe setting off a firecracker chain of derivitives on soverign debt, of which trillions in notional value exists, and essentially burys 50% of large global banks.
The large #s being thrown around, like the ECB or IMF can just pull 1 trillion dollars out of their asses has really lulled the market over time into the idea that any threat to the derivitive chain will result in the printing of trillions coming from somewhere to bail out everyone and stop it. Basically, market participants have now been led to believe that an actual disorderly default of any country or bank is impossible and will never happen.
This, I believe, is a unrealistic view of the situation.
GL
CJ
Tuesday, January 24, 2012
01.24.2012 -- Apple should top us out..
We are within 30 S&P points of at least a short term top here. The Apple earnings should be enough to push the market over the next few days and top out the MACD and pop us up to or over the trendline.
If you want this rally to be completely over, you need to root for a pretty good pop up over the trendline for a false break up to 1350 give or take 5 points and then roll over hard.
If we just touch the trendline and sell off, there may be another move north left in it.
--------------------------
Key Levels
Upside -- 1320-1330
Downside -- 1314, 1303, 1292, 1257, 1251, 1225
This is one of the longest time periods this has remained so lopsided since I have tracked these levels
---------------------------
SPX Daily (12 month)

We all know whats likely to happen as a result of the Apple earnings. This should be enough fuel to finally kick us up to our levels that should provide real resistance and start a sell off.
MACD didnt move today, still at 19.. but it will tomorrow. 24 is the magic number.
Stochs still levitating up at super overbought levels.
I think we should have a top and reversal in place by Friday or maybe Monday. What kind of top it is will be key here? If we just touch the trendline and roll over but then proceed to sell off somewhat hard but still in one of those down 150 on the DOW.. followed by a up 75 and then down another 100 and then up 40.. blah blah. One of those types of tops means theres yet another run north left.
If however, we pop up to 1350 or near and we get some kind of big intra-day reversal from big green to big red or a big green day followed by a gap down the next day that engulfs several previous days of green trading. Then proceed to selloff continually with big down days in a row. That will mean we have seen the top of this entire move.
We shall see.. won't be long now.
GL
CJ
Monday, January 23, 2012
01.23.2012 -- MACD approaching decade highs..
There's not much room left for this rally. The MACD on the daily is at 19. 24 is the decade high and we touched 24 back in October just before that very sharp sell off started.
-----------------------------
Key Levels
Upside -- 1320-1330
Downside -- 1310, 1299, 1287, 1257, 1249, 1224
----------------------------
SPX Daily (12 month)

Not a whole lot to say here, we are in the same position we have been.
MACD approaching that key 24 level, Stochs are very overbought and hanging up there.
Its still an open question of whether we will sell off some and then have yet one more surge to end this rally. There's really no way to tell yet. If we are going to end it now, I'd like to see some kind of blow off and mega reversal here. Either that or a bad earnings report or something from a key cog like Apple tomorrow that sends everything reeling in a big gap down open.
Either way, this rally doesn't make it past mid-March and could be over now with the 1321 top.
GL
CJ
Thursday, January 19, 2012
01.19.2012 -- Feels so warm and bullish
Feels so bullish and warm and like we could be at new all time market highs by the end of the year doesn't it?
-------------------------
Key Levels
Upside -- 1320-1330
Downside -- 1303, 1292, 1281, 1257, 1247, 1221
very lopsided right now
-------------------------
SPX Daily (12 Month)

I've outlined here where I think we are going. Yesterday I was thinking that we might be possibly done soon and are going to pop up over 1330 and then fail and it would be all over.
Today, I'm feeling more that we are going to reverse here soon with the false break and sell off to the bottom of the triangle and then have one more surge and then the false break higher. That will drag out this process another month or 2.
It could go either way. If we reverse soon here (tommorrow or Monday), without breaking over that trendline, I believe theres another move north left. If we go ahead here and break that trendline and shoot up to 1330-1360, then this might be the final push north.
Sentiment is all set up for a big fall.. its hard right now to see what would break this market. You can't imgaine now with all the bailouts and games and interventions how they will allow this market to fall, especially in an election year. Its manipulated... it's controlled... "they" won't let it.
All thoughts that have gone through your head right? Make you doubt being short this market?
That is the psychology of a bear market. This is a bear market rally.. welcome. Burn the bears and burn the bulls.
GL
CJ
-------------------------
Key Levels
Upside -- 1320-1330
Downside -- 1303, 1292, 1281, 1257, 1247, 1221
very lopsided right now
-------------------------
SPX Daily (12 Month)

I've outlined here where I think we are going. Yesterday I was thinking that we might be possibly done soon and are going to pop up over 1330 and then fail and it would be all over.
Today, I'm feeling more that we are going to reverse here soon with the false break and sell off to the bottom of the triangle and then have one more surge and then the false break higher. That will drag out this process another month or 2.
It could go either way. If we reverse soon here (tommorrow or Monday), without breaking over that trendline, I believe theres another move north left. If we go ahead here and break that trendline and shoot up to 1330-1360, then this might be the final push north.
Sentiment is all set up for a big fall.. its hard right now to see what would break this market. You can't imgaine now with all the bailouts and games and interventions how they will allow this market to fall, especially in an election year. Its manipulated... it's controlled... "they" won't let it.
All thoughts that have gone through your head right? Make you doubt being short this market?
That is the psychology of a bear market. This is a bear market rally.. welcome. Burn the bears and burn the bulls.
GL
CJ
Wednesday, January 18, 2012
01.18.2012 -- Getting closer still..
Today we broke to the upper range of that first resistance in that 1290-1305 area.
Just above us is a long standing trendline at 1325ish. Hard to pinpoint because it is so old, so I would put it in the 1320-1330 range. A fake breakout over 1330 would not be surprising.
------------------------
Key Levels
Upside -- 1320-1330
Downdside -- 1288, 1279, 1257, 1246, 1220
------------------------
SPX Daily (5 year)

This is where our big trendline is coming from. It is hanging around somewhere in the 1320-1330 range. It's such a long time frame that it's a little loose and thats why the 10 point range. It also would not shock me if we had a false breakout over it just before the market fails and heads south very quickly breaking the bottom of this very large triangle.
I believe we are within 25 points of topping. We could maybe false break as high as 1350, but I dont think that's going to happen, I just don't think there's enough power left in this rally to get that high.
The MACD is up to almost 17. 24 is a decade high on the MACD, there simply isn't much room left. The stochs are rolling in overbought up around 90.
Rather than feeling like a powerful rally, this just feels like a market that is refusing to roll over. Essentially just wearing out the shorts and clearning the market and pulling in a few bulls before rolling over.
Short interest is at a low point here, so I think we are at the stage of pulling in some bulls before we turn.
There still could be a fall and one last surge and this could drag out another month and a half, but we are so close to that 1320-1330 range, unless we really fall hard tomorrow, I think we are going to continue up to that range and then put in that top soon.
GL
CJ
Tuesday, January 17, 2012
1.17.2011 -- Approaching the end game
We are still on track for a major top anytime between now and March. The chart tonight shows the upper trendline that I think will mark the extent of the top we make.
-----------------------
Key Levels
Upside - 1295, 1300, 1320
Downside - 1278, 1257, 1245, 1218, big drop after that.
-----------------------
SPX Daily;

You can see here that we are struggling to take out that resistance in the 1290-1300 range. Even if we take that out convincingly, there isn't much room before we run into that trendline around 1320.
The Stochs and MACD are both way on overbought, which basically indicates that this rally is running on fumes and borrowed time.
There is still a question of whether we need one more good sized decline and yet another rally to finish the pattern.
That is where the timing comes in that we are either topping very soon or we can stretch this out until March if there are 2 moves left in this.
We will know though. When the selling begins for cycle 3 down of Supercycle C down.. it will be obvious. The selling will come fast, furious and without mercy.
GL
CJ
-----------------------
Key Levels
Upside - 1295, 1300, 1320
Downside - 1278, 1257, 1245, 1218, big drop after that.
-----------------------
SPX Daily;

You can see here that we are struggling to take out that resistance in the 1290-1300 range. Even if we take that out convincingly, there isn't much room before we run into that trendline around 1320.
The Stochs and MACD are both way on overbought, which basically indicates that this rally is running on fumes and borrowed time.
There is still a question of whether we need one more good sized decline and yet another rally to finish the pattern.
That is where the timing comes in that we are either topping very soon or we can stretch this out until March if there are 2 moves left in this.
We will know though. When the selling begins for cycle 3 down of Supercycle C down.. it will be obvious. The selling will come fast, furious and without mercy.
GL
CJ
Wednesday, January 11, 2012
01.11.2012 -- Major top within 1.5 months
A major top is approaching and can occur anytime between now and the beginning of March.
I believe we have one more pullback in this current rally and then one last surge, but that may or may not be the case.
The first week of March is a major Bradley turn date. That is the main reason I suspect there is one more big pullback and one last surge remaining in this rally.
-----------------------------
Key Levels
Upside -- 1311
Downside -- 1274, 1258, 1241, 1234, 1214
-----------------------------
SPX Daily;

Our old wedge is broken to the upside, but without much power and follow through. So I had to back out to a 10 month chart from a 6 month and we find the last downtrend line here that is currently sitting about 1311.
I think a false break of that trendline north sometime in the next 1.5 months, followed by a fast and furious reversal. (Preferably intra-day reversal) It could happen soon or we could go through one more pullback here followed by the last surge.
This will be a major top.
There's not much else to say right now, other than I expect us to touch and most likely exceed that downtrend line in a fake breakout before we truly reverse and begin the big wave 3 down that will finally end the global government ponzi debt bubble.
GL
CJ
Wednesday, January 4, 2012
01.04.2012 -- Happy New Year
Hi again folks. I will be doing some short updates from now until the end of next week and then be back to my normal posting.
Thanks for all the kind notes, the baby is doing great and the family is adjusting well. :)
------------------------
Key Levels
Upside -- 1284, 1345
Downside -- 1270, 1258, 1249, 1238, 1228, 1208
extremely lopsided to the downside.. a turn is coming soon
-----------------------
SPX Daily;

What we have here is obviously a big rising wedge. The other larger wedge was broke north but there was no real follow through or power associated with it as you can see.
I tend to think this is a fake break north from the larger wedge and we are about to either fake break the smaller one too and then fail or fail here very soon.
The stochs and MACD are both in overbought territory but do have some room for a continued push north, but not a ton of room, just a little.
We printed a DOJI hammer today.
What to watch for now is a big intra-day reversal. A big up day that reverses and closes heavily negative. That is a classic reversal signal that we have not seen in a long time.
GL
CJ
Subscribe to:
Comments (Atom)