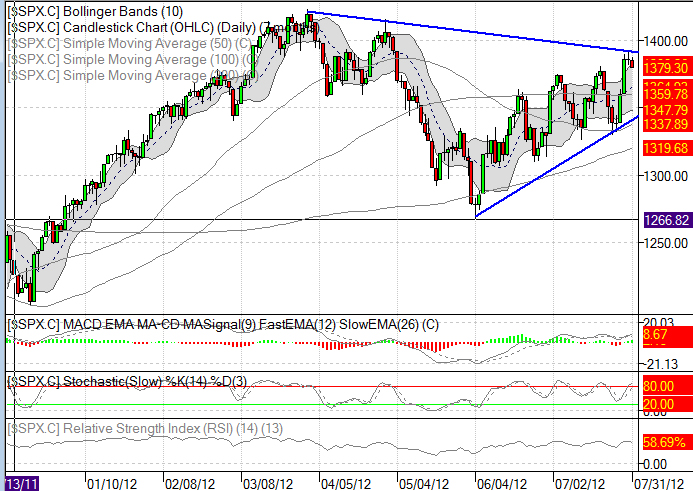
I did find something of interest though in the daily and weekly charts.
The Daily chart ( 7 months ) and Weekly chart ( 7 years ) are sporting the exact same pattern. It's actually quite striking how similar they are.
The only problem is that both patterns are at the same exact point in their development. So there's nothing to foreshadow.
What I can say though, is whatever happens next will be confirmed in all 3 longer term timeframes. The Monthly, Weekly and Daily. Because they are all sporting the same pattern.
Here they are;

No comments:
Post a Comment