The market tripped my tightened stop today on TNA. I locked in a gain on that trade of a little over 20%. I am sidelining myself here to see what happens in this relatively tight spot from 1270-1253(200 dma). If we open red tomorrow, I may jump right back on board here in anticipation of a quick drop to the 200. Otherwise, I will be watching for a bounce to re-enter.
If you have no position, I would not enter a new position here.
Our targets and patterns have not changed, so I will just present the charts with the notes;
The S&P printed a neutral Doji today. This sell off has a parabolic feel to it as I've marked and we are inside of 20 points to the 200dma;

The Russel looks similar to the S&P, but it has even less room to the 200dma;

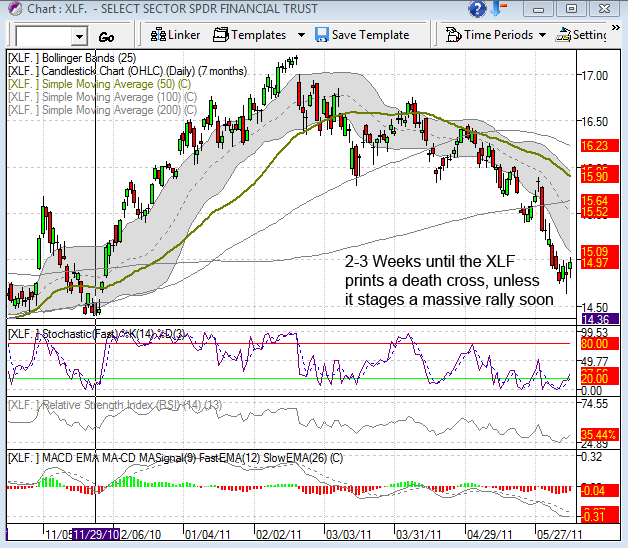
The XLF has only a few weeks at most until it gets a death cross. It will need a pretty hefty rally to avoid it;
The 200dma's will obviously provide some type of resistance to this selloff considering how oversold we are, but I am certainly leaning towards taking out the 200dma's after we bounce off it. That would take a move to new highs off the table. If we hold the 200's, we still must consider we may see new market highs this year.
GL
CJ
No comments:
Post a Comment