Tuesday, August 9, 2011

08.09.2011 -- What now CJ?

How would I know? ;)

Key Levels;

Upside -- 1176, 1239, 1276

Downside -- 1102 (what we will now refer to as "the bottom" for now)

----------------------------

Before I get to charts, there were some good lessons learned the last few weeks;

1) Bull rallies take years, massive selloffs happen very quickly. You have to be on the train before it starts moving or you miss it.

2) 3x ETFs slippage is massive. We'll use TZA (3x inverse of Russel 2000) as an example. TZA hit a high today of 69$. IWM hit a low of 63.79. Last time IWM was at 63.79 was 09/10/2010. At that time, TZA was at 96$. For a 1 year slippage loss of 30%. ... if you go back further its even worse, on 01/04/10 IWM was also right around 63.79... TZA on 01/05/2010? 143$. Get it folks.. DO NOT hold these things long for long periods of time, you lose. If anything, short the opposite. Dont go long TNA (for more than a few weeks).. short TZA and vice versa.

3) Bear market rallies will rip you a new asshole.

------------------------

Charts;

SPX Daily (25 year)


We appear to have bounced off the long term uptrend line you see here. That indeed is powerful support. You can see it stopped the 2000 bubble pop, but it did not stop the 2008 selloff. It has stopped us here temporarily, but I believe we will break it, its just a matter of time.

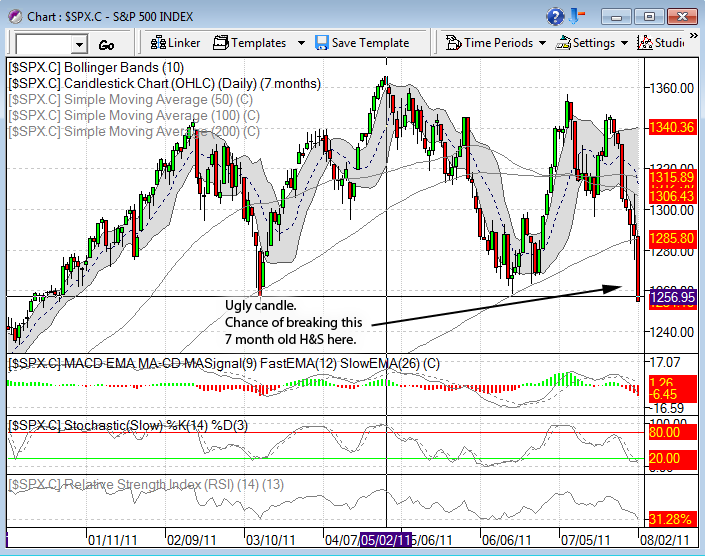
SPX Daily (3 months)


So here's our short term picture. We closed just below the bollinger bands on the daily. I have to think that we're probably going to climb back in them, but maybe not before some additional selling. However, if we break back into the bollinger bands at any point, the target becomes AT LEAST 1239, and more likely we may test the 200dma.

---------------------------

I want to talk overbought and oversold for a bit. Obviously, as I've mentioned before, being oversold/overbought doesn't mean a whole hell of a lot in these types of moves. They can just keep becoming more and more extended, as we have seen.

However, they are still of some use to us. Pay attention to the overbought/oversold indicators in the following charts.

This will be a lot of charts.. but its necessary to display to you my opinion here;

S&P 5 Minute chart;


We are obviously extremely overbought on a 5 minute chart. So on a very short term basis, we may see some pullback here, but because this is a 5 min chart, the pullback could last less than an hour.

SPX 10 min.


Also very overbought. So again on a short term basis, we could have a pullback here soon. But again, it may only last a couple hours now.

SPX 30 min.


Ok. Here we are becoming overbought, but we are not quite there. So we have room in a 30 min chart for more buying. So now what we have is a potential pullback that lasts a couple hours.. followed by several hours of more buying.

SPX hourly


K folks.. what do we have here? The hourlies are JUST starting to turn up off very oversold. So now what I think may happen is a couple hours of pullback/selling, and then now another round of buying that may last several days to a week or more.

SPX Weekly


Now what do we have? The weeklies are in the middle of a fall and have more selling to do. So now what's expected is about a week or so of buying, followed by more intense selling that lasts in terms of weeks to a month.

SPX Monthly


And the monthlies. The monthlies JUST STARTED rolling over.

So what do you get from all that? You get that we are likely to see a rally that lasts up to a week or so here, but then quickly heads south for another round of major selling that lasts several weeks. After that, we likely will have another bounce at some point and will have to re-visit this exercise again to time it, but overall the monthlies say this market will be heading in a primary direction of down for a long time.

------------------------

No death cross yet, but its very close. I think we have one by end of the week unless the S&P rallies some 200+ points in a few days.

GL

CJ

Monday, August 8, 2011

08.08.2011 -- Crash or dash.. pick one..

We are either going to completely fall apart here and do a 1987 swan dive to who knows where... or we are going to find a low here soon and have a rip roarer of a rally.

Key Levels;

Upside -- 1193, 1255

Downside -- 1080's ish, 1068, 1037

-----------------------

SPX daily ( I had to back out to 25 years to find where a bounce might come trendline wise)


These are 2 long term trend lines that exists since the early 80's. These will be 2 areas of powerful support. 1 is only about 20-30 points below where we are right now.

Because of the severity of this plunge though, there's really no telling when we might suddenly reverse and rip higher.

The risk of a 1987 style crash exists here. The levels of support are very spread apart here and we appear to be in the bottom part of a parabolic sell off.

Between where we are right now and 1068, there are definitely long term support lines. Powerful ones. Pinpointing them is difficult because changing how you draw the line ever so slightly can result in a 20 point change in target. So it makes for a range... here to 1068 is definitely a range of major support.

Below that gets hairy (as if this isn't hair enuogh already).. theres sort of an airpocket from there to the 800s on the S&P.

------------------------------

At this point, theres almost no way to avoid a death cross. The spread of the 50 to 200dma was 10 points this morning. We'll probably get a cross by Thursday, even if we have a violent bounce.

So whether this market has a violent bounce here... or we just continue this plunge and crash 1987 style... one way or the other... we are now in a bear market and it's going to get ugly.

------------------------------

The market is forward looking by 6 months to a year or so. Meaning, its predicting whats going to happen in the economy anywhere from 6 months to 12 months from now.

Obviously, this means things are going to look significantly worse heading through the beginning of next year.

There will be some bank closures, the unemployment rate is probably going much higher, and overall standard of living is going to come down.

I suggest you assume these things will happen and take appropriate steps in your life.

GL

CJ

Sunday, August 7, 2011

08.07.2011 -- OMG!! THE WORLD IS GOING TO IMPLODE!!!

Careful when sentiment sounds like the title of this thread if you're a bear.

Key Levels

Upside -- 1230, 1276, 1286

Downside -- 1168, 1116, 1093

--------------------------

Just 1 chart tonight, because of the circumstances anything can happen, so I think trading off pure technicals is out the window...

SPX Daily (3 year)


Notice that we've held that channel now twice. The market still has a chance to be in an uptrend, there still COULD be another big rally left before real hell breaks loose.

No doubt though, the market is in real trouble right here. We are well below all moving averages and there's very little strength anywhere.

Sentiment has obviously shifted pretty drastically in just 2 weeks. I would be careful here if you're a bear. Could we crash here and now? yes we could.. the conditions exist for it to happen. I tend to think though that we may get a surprise rally tomorrow and hold that channel and get a ripping rally out of nowhere that drastically shifts sentiment yet again and primes the pump for the real plunge.

I'm interested to see what happens to treasury bonds tomorrow. If bond yields aren't doing a rocket shot.. I would be wary of remaining short. If yields go phsyco north though, we may be staring at a real plunge into darkness here and now. Honestly though, I dont expect that, but bond yields will a good tell.

Crazy crazy stuff... should make for an interesting night and day tomorrow.

GL

CJ

Thursday, August 4, 2011

08.04.2011 -- So much for that chance...

Key Levels

Upside -- 1249, 1286

Downside -- Hell .. haha... 1175-1185 better hold

-------------------------------

Yeah, so, that hammer didn't mean shit. Horribly ugly day that has cemented in some kind of major economic smashing already building.

You'd think we'd be extremely oversold on the daily, but we arent really yet. We're definitely quite oversold, but I've seen much worse extreme's than where we are now.

On the Monthly... We JUST STARTED rolling over!!.. ouch.

SPX Daily; (had to move to 2 years from 7 months)


1175-1185 is the only thing stopping us from violating an multi-year uptrend. There market absolutely HAS to make a stand there. If we violate it, my long term target (with many bumps along the way), becomes something in the S&P 350-450 range. Not sure what America will look like with the S&P sitting at 350.

We may have a violent bounce in the meantime, but this down move WILL test that trendline.. so that 1175-1185 area is very likely to be tested.

Here's an SPX monthly chart for 10 years;


Look at the MACD, Stochs and RSI... they JUST STARTED rolling over. That is somewhat horrifying that we are at 1200, tanking horribly and the monthlies just began to turn at the top of overbought conditions.

The monthlies have violated that multi-year uptrend line already btw. So about 30 points lower than we are now and all support is lost.

Also note that the tankage here is looking worse than the 2007 top. Also horrifying.

----------------------

Everything is broke... giant 7 month H&S pattern in the S&P, 7 month giant Mega-phone patterns in the Russel 2000 and Transports.

Here are those 2 charts for you;


-----------------------

This is probably winning the "ugliest shit i've ever seen" contest in the markets.

There's no support anywhere..there's no strength left at all. It's just massive across the board selling and treasuries yields are cliff diving into deflationary hell zone.

-----------------------

Don't want to get too doomy here, the market can still hold 1175-1185 and remain in an uptrend.

If that breaks though... if we solidly break the multi-year uptrend line.. all of our lives may be radically different in 2-3 years.

GL... seriously.. GL

CJ

Wednesday, August 3, 2011

08.03.2011 -- Reversal?

Key Levels

Upside -- 1274, 1286, 1305

Downside -- 1241, 1229, 1175

------------------------------

Don't have a ton of time again tonight, so quickly;

SPX Daily;


The market managed 2 things today.. it printed a big reversal "hammer" candle. It also closed back above the neckline of the huge H&S.

It appears that the market will attempt to correct oversold levels on the daily and make some sort of run here. Pay attention to how strong this rally is. (if we do get one)

The market is by no means out of the woods. It just gave itself a chance today. All indicies are still below all moving averages and the charts still look very bad.

It has a chance, so lets see what it does with it. At a minimum, it needs to get back over the 200 at 1286.

GL

CJ

Tuesday, August 2, 2011

08.02.2011 -- Stab twist

Ouch.

God damn, I'd hate to see what would have happened had they voted no.

Key Levels

Upside -- 1285, 1306, I'll update further than that if necessary tomorrow

Downside -- 1249, 1175, 1129. yeah.. we are pretty much in crash land, theres like 50 point chunks between support and none of it is strong.

---------------------------

This is why I said that I was confused about what we are pricing in. We obviously weren't pricing in a possible NO vote. I believe we are pricing in an unavoidable bout of deflation. You see it in the treasury market and you see it now in the stock market. It only needs to start becoming very obvious in the dollar.

It will be interesting to watch gold. Gold will continue to be the hedge against world order collapse, but at the same time, we may see the dollar soar here. If we ever get to a point where the dollar is soaring, we are deflating, but it becomes obvious that the world isn't going to devolve into mad max land, we could see a gold collapse. It is not impossible. I know Tyler Durden will argue that to the end of the earth and he certainly has reasons to think that, but it is possible that we deflate without destroying civilization. Gold would not like that. Zerohedge though could correctly surmise that the overlord Bernanke will continue on his money printing extravaganza to the point of causing the end of civilization, thus Gold is certain to win, but.. honestly, do you really "win" if that happens?

Charts are fugly folks.. If the market is going to drag in bears and then do a mega-reverse, it will do it soon. If it doesn't do it soon, it is most likely doomed.

SPX Daily;


We might have broke that 7 month Head and Shoulders. There's still a pin bottom to contend with at 1249. The market BETTER hold 1249. Below that on a close would be an obviously broke pattern and a very large one at that.

Spread between the 50 and 200 is 21 points now. It will be less tomorrow.

Russel 200 (IWM) daily;


We lost the Russel 2000. It seems to have broken some type of either megaphone or messy head and shoulder pattern. It's well below the 200dma. It's a pretty convincing break too.

DOW Transports;


The Trannies are on the very edge of breaking a 7 month mega-phone top. They haven't broken it yet, but it's right there. It best make a stand here. Trannies are the only thing that isn't quite broken yet. It's well below all moving averages though, it just hasn't quite broken this huge pattern.

DOW Industrials;


DOW looks broke too, although it has some decent support around 11600. But it's also below the 200 and appears to have broken below a big channel.

---------------------------

Don't know what else to say here. The market better reverse hardcore here within a few days. If not... not good things are going to happen. There is very little support down here, and what support there is was built on such low volume churn that it's like standing on super thin ice.

I think we're toast, but of course usually when I think that is when a huge reversal comes out of nowhere, but it's hard to argue these charts.

Almost every index and sector is well below the 200dma..

Semi's
Financials
Russel 2000
Trannies
S&P 500
Industrials
Even the Fucking REIT's and DJUSRE sold off below the 200.

There's nothing left to support. I'm not sure when the last time I've seen a state like that is... probably well into the 2008 collapse.

AND on a freaking YES vote to the debt ceiling. I kind of saw that coming yesterday, but wow. It seems like nothing short of announcing QE3 for something that has trillions in it is going to move this thing.

Put yer helmets on... and stock up on food, water, and cash.

GL

CJ

Monday, August 1, 2011

08.01.2011 -- 1 day left

Key Levels;

Upside - 1299, 1308, 1316, 1318 and 1340

Downside - 1285 and 1261

--------------------------------

Sorry, don't have a lot of time to get too in depth here.

SPX Daily;


Luckily for me, there isn't a whole lot to talk about here.

We are sitting right on the 200dma. It's do or die time for the market. Interestingly, this is occurring just as we are running up on the debt ceiling debate and deadline.

We have a large Head and Shoulder formation in play and any significant move below the 200dma is going to put a death cross in play. The spread between the 50 and 200 will be down to about 21.5 points tomorrow. The 50 is declining and the 200 is still rising and leveling off. Any further tankage will cause the 50 to fall that much faster and close that gap quicker.

The Daily is getting oversold, but it is not extreme yet, we could still sell off quite a bit here before a bounce.

I'm very curious to see what the market does based on this vote. I'm inclined to think that we may sell off on a Yes and sell off twice as hard on a No.

We'll see soon enough...

GL

CJ